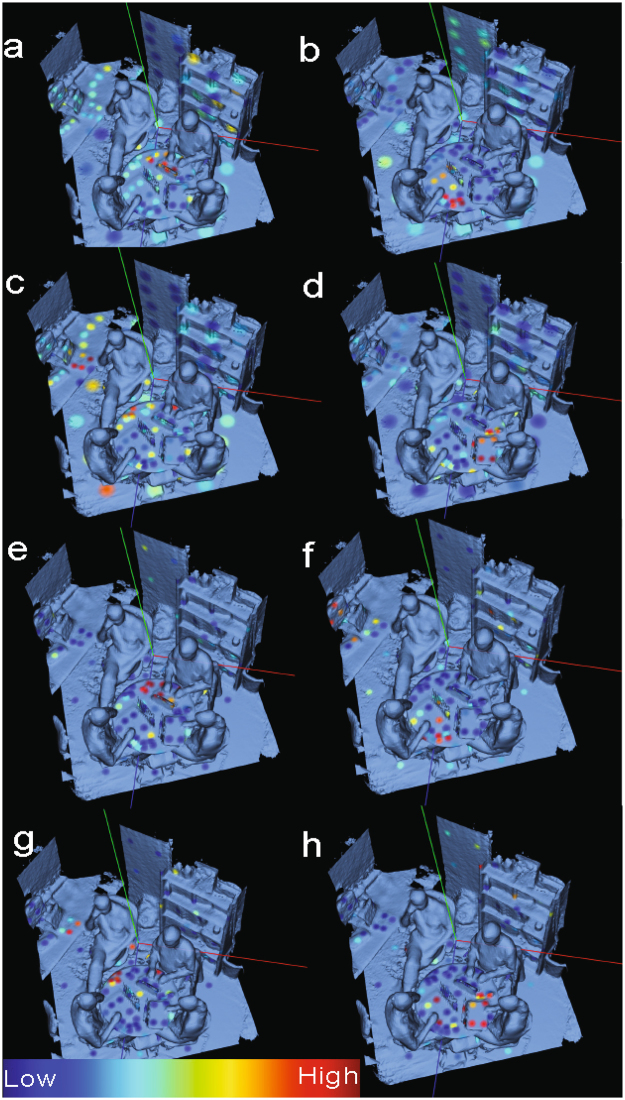
Figure 4.
Distinguishing office interactions through chemical and microbial signatures using 3D cartography. Source tracking based on LC-MS profiling (a–d) as well as 16S amplicon microbial analysis (1e–h) illustrates the points and intensity of source tracking between volunteers 1–4 and samples sites across the office. Higher probability that molecular features from a sample site belong to a designated volunteer is indicated in red. Blue spots represent a lower probability that molecular features belong to a particular volunteer. Source tracking data based on volunteer 1 is shown in (a,e). Source tracking based on volunteer 2 is (b,f). Source tracking based on volunteer 3 is (c,g). Source tracking based on volunteer 4 are (d,h).

