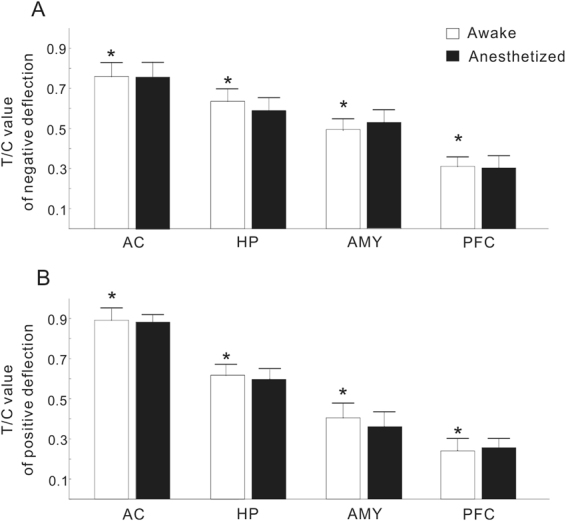
Figure 9.

T/C values of negative (A) and positive deflection (B) under conscious and anesthetized conditions in different brain regions. The data indicate that the degrees of IG are different among different brain regions, but similar between conscious and anesthetized conditions. The data are expressed as the mean ± SE; *Represents a significant difference between any pairs of comparison of T/C values under conscious conditions (P < 0.05, ANOVA with Tukey’s post hoc test).
