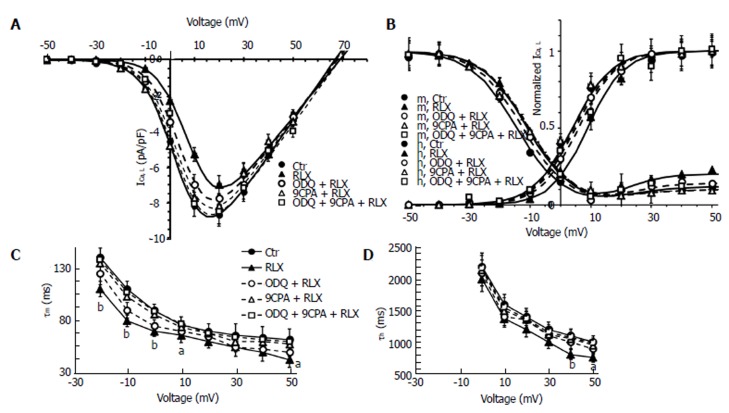
Figure 5.
Relaxin affects ICa,L voltage dependence and kinetics in smooth muscle cell of the mouse ileum. A: I-V plots of L-type Ca2+ currents (ICa,L) recorded in Ctr (filled circles), RLX (filled up triangles), ODQ + RLX (open circles), 9CPA + RLX (open up triangles) and ODQ+9CPA + RLX (open squares) from experiments as in Figure 4. Statistical significance not shown in the plot for clarity; B: Steady-state ICa,L activation (m) and inactivation curves (h) in all the conditions tested; the best fit to the inactivation data is obtained by the sum of two Boltzmann terms. A and B: The Boltzmann fits for Ctr and RLX are superimposed to the experimental data as continuous lines, those related to ODQ, 9CPA and ODQ + 9CPA as dashed lines. Data are mean ± SE. Boltzmann parameters, statistical analysis and number of analyzed cells are listed in Table 1. Current values are normalized to cell capacitance (pA/pF). C and D: Voltage dependence of the time constant of ICa,L activation (τm) and inactivation (τ h). aP < 0.05 and bP < 0.01 RLX vs control SMC (Ctr). P < 0.05 for 9CPA + RLX and for 9CPA + ODQ + RLX vs RLX alone for the -20, -10 and 0 mV (τm data); P < 0.05 for 9CPA + RLX, ODQ + RLX and 9CPA + ODQ + RLX vs RLX alone for +40 and +50 mV (τ h data). Statistical significance for the inhibitors not shown in the panels for clarity (one-way ANOVA and Newman-Keuls post-test), RLX: Relaxin; ODQ: Oxadiazolo[4,3-a]-quinoxalin-1-one; 9CPA: 9-cyclopentyladenine.

