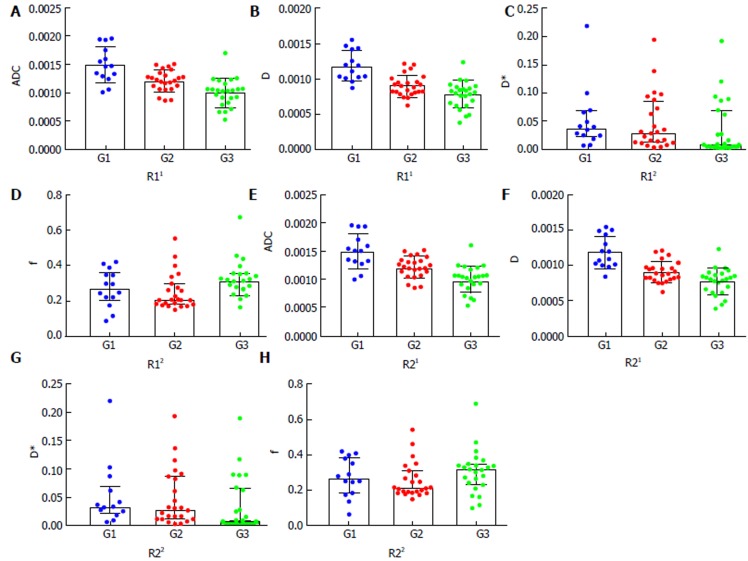
Figure 4.
Column and scatter plot diagrams reporting the quantitative comparison of the differences in the intravoxel incoherent motion and conventional diffusion-weighted imaging parameters among the three groups of hepatocellular carcinoma. A-D: Quantitative comparison of the differences among the three groups in the ADC, D, D*, and f values, respectively, by radiologist 1; E and F: Quantitative comparison of the differences among the three groups in the ADC, D, D*, and f values, respectively, by radiologist 2. The differences in the ADC and D values among the different grades were statistically significant (P < 0.001); the differences between the G1 and G2, G1 and G3, and G2 and G3 were all statistically significant (P < 0.05). No statistical significance was found for the D* or the f values (P > 0.05). ADC, D, and D* are in units of mm2/s; f is in unit of 100%. 1Mean with SD; 2median with interquartile range. R1: Radiologist 1; R2: Radiologist 2; HCC: Hepatocellular carcinomas; IVIM: Intravoxel incoherent motion; DWI: Diffusion-weighted imaging, ADC: Apparent diffusion coefficient.

