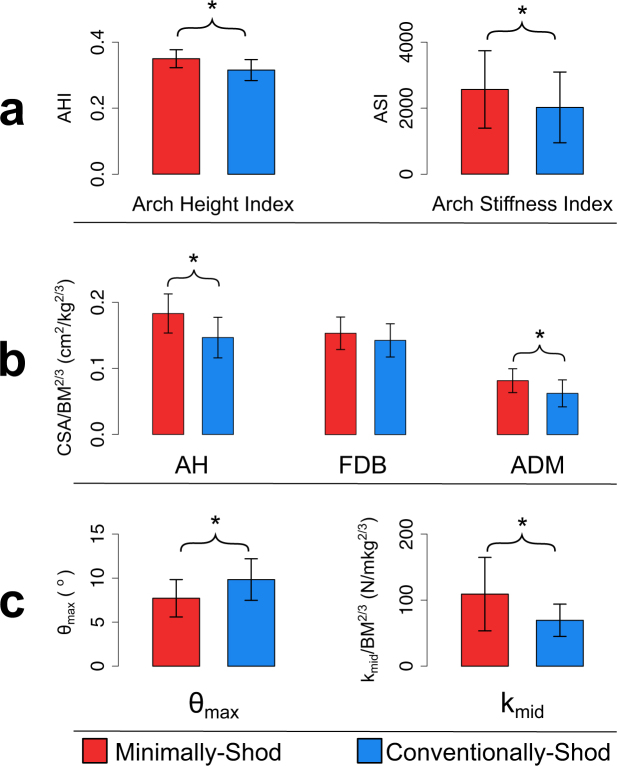
Figure 4.
Results of comparisons between minimally- and conventionally-shod individuals. (a) Static measurements of arch height index (AHI) and arch stiffness index (ASI). (b) Muscle cross-sectional area (CSA) measurements. Note that values are scaled by (body mass [BM])2/3. (c) Dynamic measurements of maximum arch deformation angle (θmax) and arch stiffness (kmid). Note that kmid is scaled by (body mass)2/3. * denotes statistically significant difference between groups.

