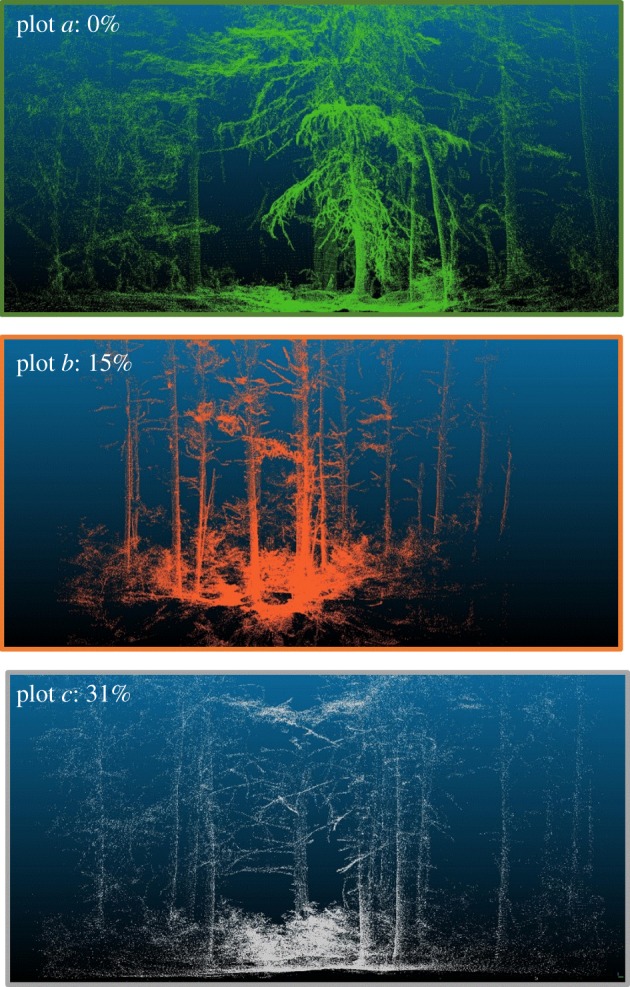
Figure 2.

CBL scans of progressive mortality in the HF ForestGEO plot. (a) 0% hemlock mortality: intact branches distributed from the canopy to the ground with needles. (b) 15% hemlock mortality: loss of needles on lower branches and beginning of understorey vegetation establishment. (c) 31% hemlock mortality: branches bare, canopy damage and new understorey growing in the canopy gaps. Note: Each scan is taken from the centre of a 20×20 m plot, colour-coded and labelled here as a, b and c and seen on figure 3. Scans taken during summer 2016 and rendered using CloudCompare (www.cloudcompare.org).
