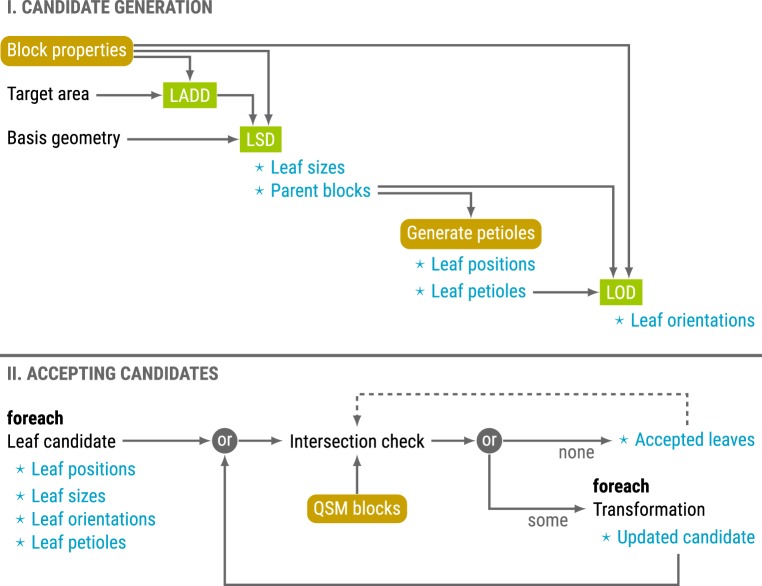
Figure 3.
Process overview of the leaf generation process. Leaf distributions are drawn in rectangular boxes, and functions and properties related to the QSM in boxes with rounded corners. The main outputs are noted with a star. The two stages are presented on top of one another. (Online version in colour.)

