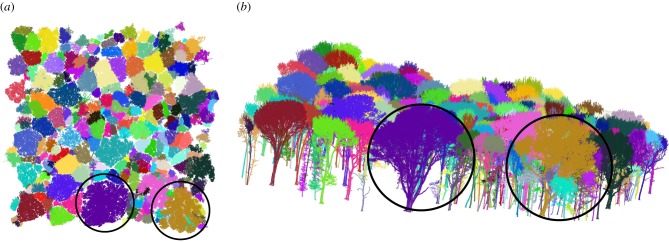
Figure 2.
Terrestrial laser scanner data from deciduous woodland, Wytham Woods, UK, showing separate tree point clouds, and example trees used in the analysis below. (a) Plan view of 1 ha TLS point cloud. The extracted point cloud of each tree is coloured separately. The sycamore (Acer pseudoplatanus, left) and ash (Fraxinus excelsior, right) trees analysed below are circled. (b) Oblique view, with the sycamore and ash trees again circled.

