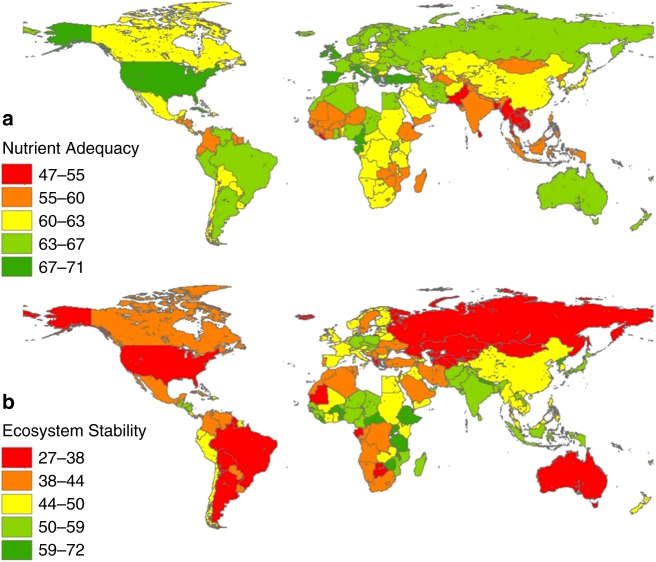
Fig. 3.
Nutrition and Environmental metrics scores per country. a Food Nutrition Adequacy and b Ecosystem Stability scores for all countries calculated in this study (based on data for the year 2011). Metric score is arithmetic average of its underlying indicator scores (normalized to 0–100). Symbology based on Jenks natural breaks classification method. It can be seen that most countries with high Food Nutrient Adequacy score low on Ecosystem Stability, pointing toward high environmental impacts associated with their diets (see Supplementary Data 1 for all values)

