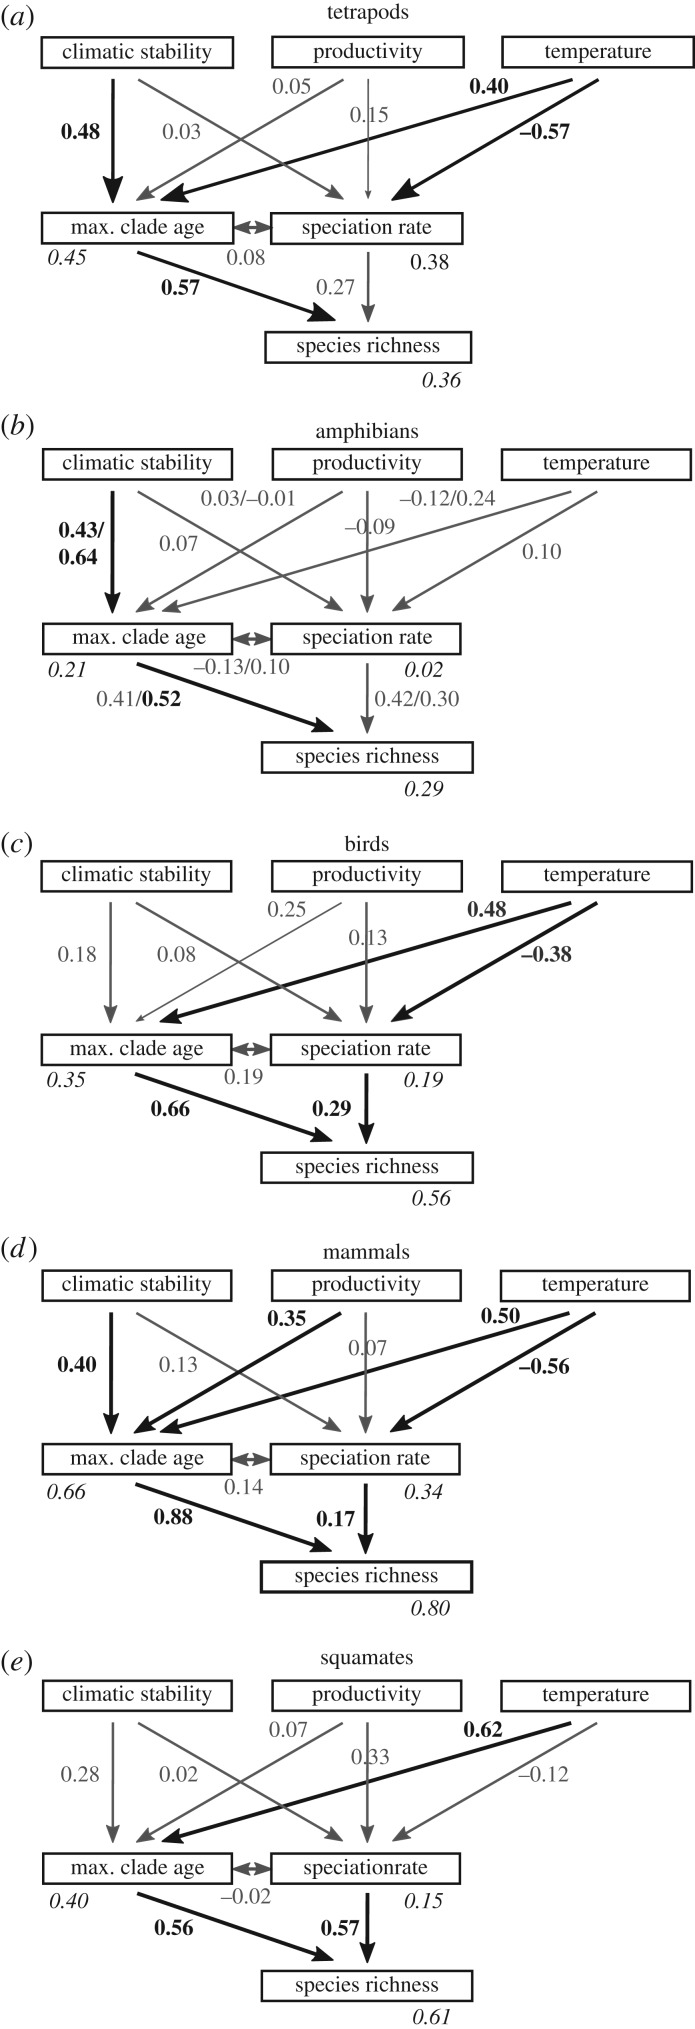
Figure 3.
Structural equation models depicting the associations of direct and indirect variables with species richness (without dispersal rate, model 2). Maximum clade age and speciation rate are the direct variables and area through time, productivity and temperature the indirect variables, for (a) tetrapods, (b) amphibians, (c) birds, (d) mammals and (e) squamates. Bold path arrows represent significant (at p < 0.05) associations. Numbers adjacent to arrows represent β-standardized regression coefficients. r2-values associated with each exogenous variable are in italics. For amphibians, we also indicated β-standardized regression coefficients and r2-values after the removal of the outlier clade of Mediterranean Alytidae (12 species) if the result changed (value in second position). max., maximum.

