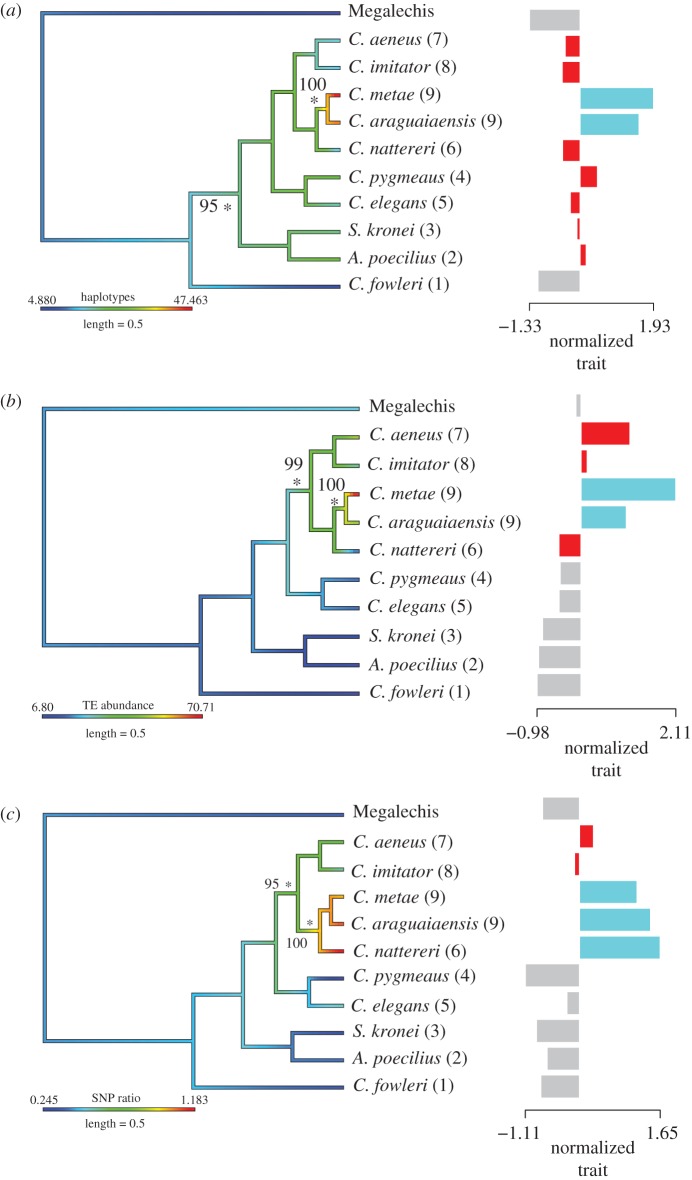
Figure 2.
Phylogenetic trees based on RAD sequence data with lineage in parenthesesm: (a) haplotypes per contig, (b) TE abundance and (c) SNP read ratio per contig mapped on in colour. Stars indicate nodes where shifts in trait values occur with bootstrap support. The right-hand panel shows the positive and negative shifts in trait size identified by l1ou. Different colours in right-hand panels indicate shifts in magnitude of trait.

