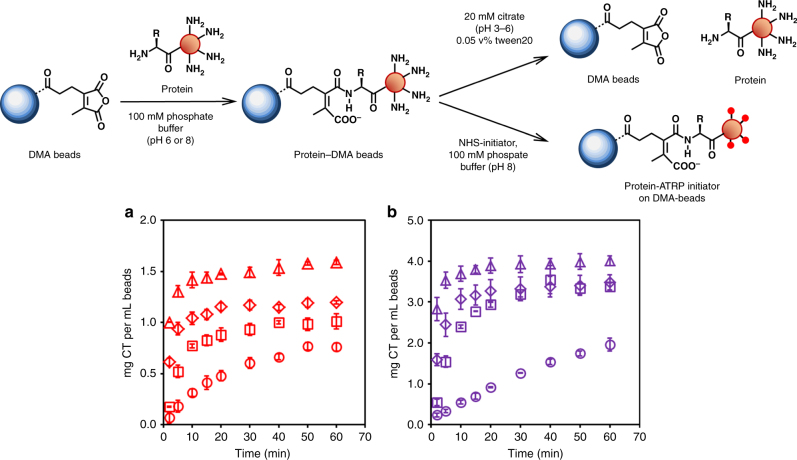
Fig. 2.
Reversible protein immobilization to DMA–agarose beads and ATRP initiator modification. a Chymotrypsin release kinetics as a function of pH (3–6) after initial immobilization at pH 6.0 (red, determined by microBCA protein assay) and b after initial immobilization at pH 8.0 (purple, determined by microBCA assay). In both plots, release was performed by incubation at pH 3 (open triangle), pH 4 (open diamond), pH 5 (open square), and pH 6 (open circle). The amount of recoverable protein and release rate increased as pH decreased. Error bars represent standard deviation from triplicate measurements

