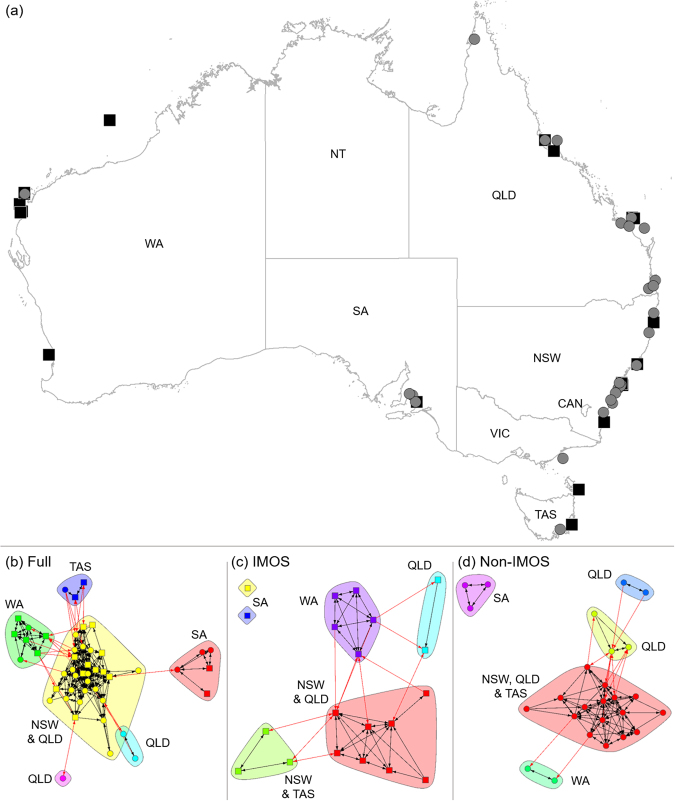
Figure 1.
(a) Map of continental-scale acoustic telemetry installations around Australia with squares indicating IMOS installations and circles non-IMOS installations. Installations are considered to be a group of receivers deployed in a specific region. (b–d) Unique network clusters for each installation type. Clusters were a factor of geographic regions, indicated by state acronyms. Colors are not related between subplots. Arrows indicate connection across installations between (red) and within (black) clusters. IMOS installations in SA (c) have no connections and are considered isolate. The map of Australia was made in ArcMap 10.4.1, part of ArcGIS 10.4.1 for Desktop (http://desktop.arcgis.com/en/).

