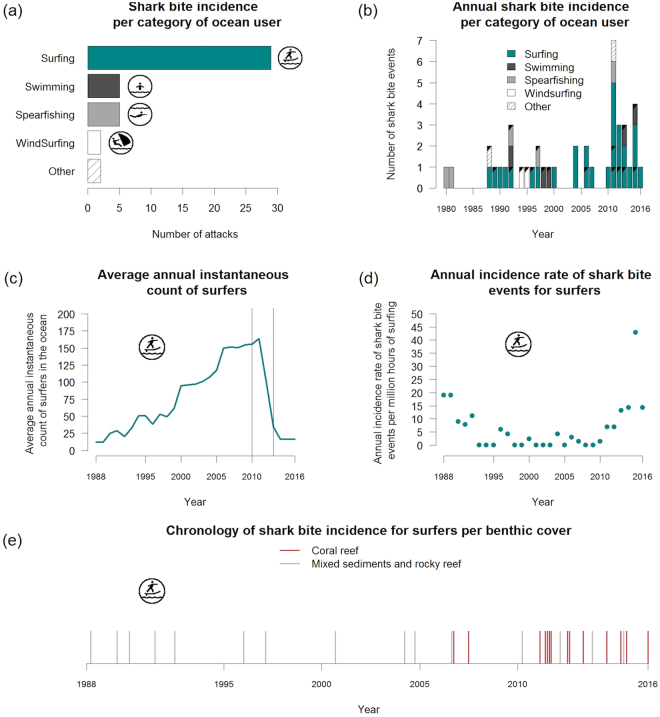
Figure 2.
Shark bite incidence and incidence rate from 1988 to 2016 in La Réunion (43 events selected over 51 recorded). Incidence of shark bite events per category of coastal ocean-users (a) and per year (black triangles indicate fatal events) (b), reconstructed average annual instantaneous count of surfers (ICS) (the two vertical lines indicate the aerial survey period 2010–2013) (c), annual shark bite incidence rate for surfers (per million hours of surfing) (d) and the chronology of shark bite incidence for surfers (n = 29 events) per benthic substrate cover (coral reef in red) (e).

