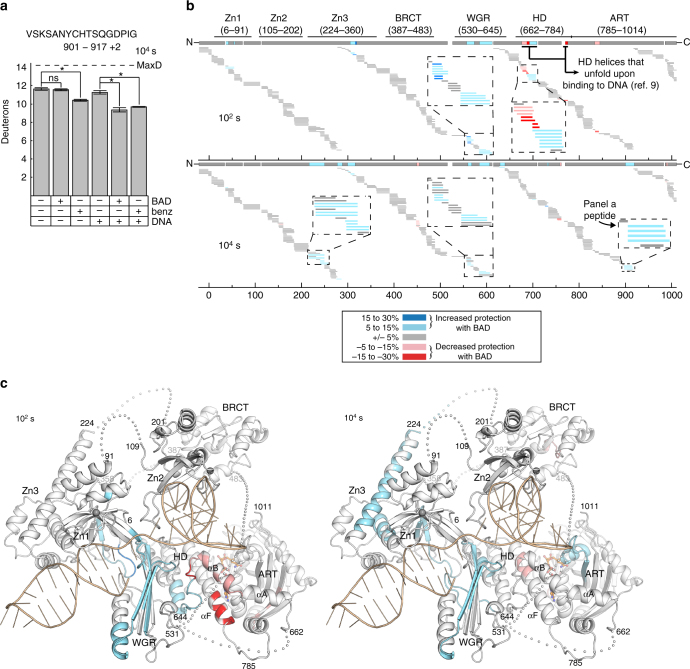
Fig. 5.
HXMS analysis of NAD+ analog-dependent changes in PARP-1 dynamics. a Level of deuteration at 104 s of a peptide from NAD+ binding site (a.a. 901–917, charge state + 2) in the absence or presence of DNA (dumbbell DNA containing a central 1 nt-gap) and in the absence or presence of either BAD or benzamide. Errors were calculated as a standard deviation from three independent measurements. Maximum possible deuteration for the given peptide is shown by dashed line (MaxD). An asterisk denotes significant differences (*, P < 0.0005), with others marked as not significant (n.s.). b Percent difference in deuteration for each peptide, represented with horizontal bars, was calculated between DNA-bound PARP-1 samples in the absence and presence of BAD at 102 s (top panel) and 104 s (bottom panel) time points. Peptides that exhibit increased protection from deuteration upon BAD binding are shown in blue colors, whereas the ones with decreased protection from deuteration upon BAD binding are in red, as shown in the insert of the top panel. Each peptide color indicates the average percent difference in deuteration for the whole peptide, therefore there are some overlapping peptides where one exhibits difference in deuteration pattern, whereas the other one does not. The consensus behavior at each PARP-1 residue is displayed in the horizontal bar below the PARP-1 domain annotation. Gaps in protein coverage are indicated with white spaces. When available, data for multiple peptide charge states are presented. c The consensus for the HXMS data from panel b at 102 s and 104 s has been plotted on the combined crystallographic and NMR structure of PARP-1 in complex with a DNA single-strand break6–8. The linker residues (each shown as an individual sphere) and the BRCT (BRCA1 C-terminus) domain were manually positioned

