Figure 5.
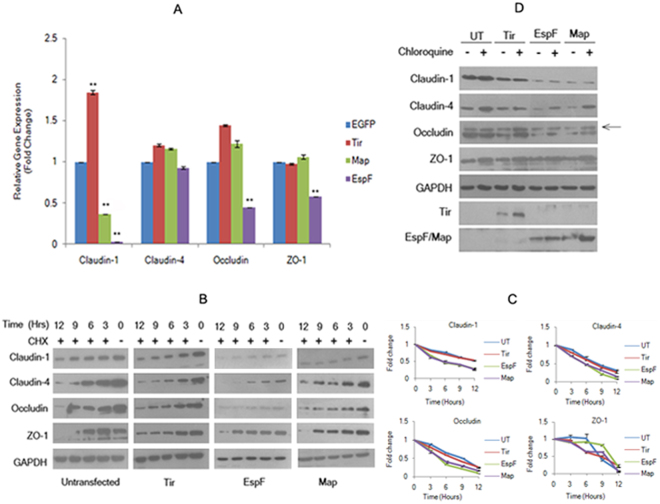
Map and EspF modulate the transcriptional and post-transcriptional regulation of tight junction proteins. (A) Relative quantitation of gene expression. Relative expression of claudin-1, claudin-4, occludin and ZO-1 in cells expressing EGFP, Tir, EspF and Map was determined by qPCR using TaqMan gene expression assays. Shown are fold changes. Data are represented as means ± s.e.m. from three independent experiments; **represents p-value < 0.001. (B,C). Expression of EspF and Map affects the stability of TJ proteins. Confluent cultures of cells were treated with cycloheximide (25 μg/ml) for 3, 6, 9 and 12 hours prior to cell lysis and analyzed by immuno-blotting with the indicated primary antibodies. Full-length blots are presented in Supplementary Figure S5. (C) The fold changes with respect to untransfected cells (normalized to 1) were calculated by estimating the band intensities using ImageJ software and plotted. (D) Effect of the lysosomal inhibitor chloroquine on the amounts of TJ proteins. Confluent cultures of cells were treated with 100 µM chloroquine for 18 hours and cell lysates were analyzed by immuno-blotting with the indicated antibodies. Experiments were performed three times and representative blots are shown. UT: Untransfected. Full-length blots are presented in Supplementary Figure S6.

