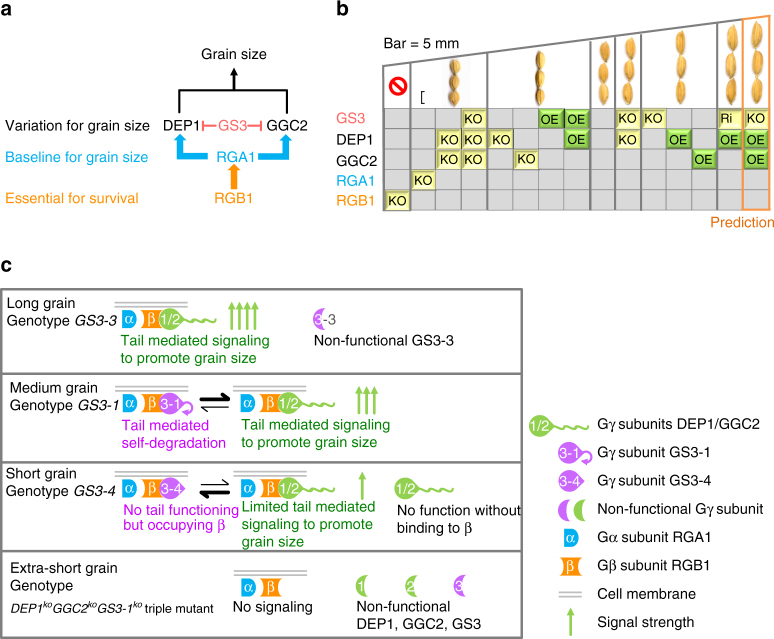
Fig. 3.
Schematic representation of the functions of the G proteins in grain size regulation. a A genetic model depicting the pathway of the G proteins in grain size regulation. The black arrow indicates positive effect, and the red bars represent negative effect. b Manipulating grain size by combinations of G proteins. KO indicates knocking out of the gene, Ri for RNAi plants, and OE for overexpression of the gene. The empty space indicates wild type. c A model explaining how these Gγ proteins work

