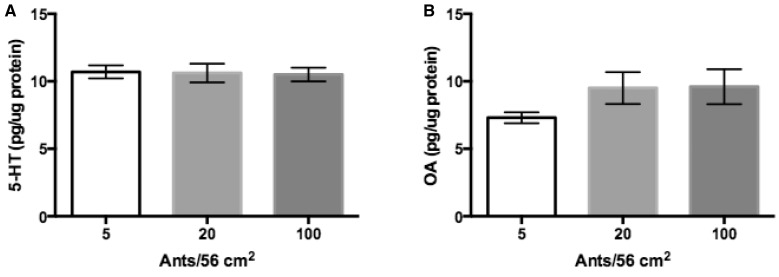
Figure 3.
Increasing density of ants is not sufficient to explain variation in brain levels of monoamines in laboratory density test. Means with SEM. (A) 5-HT: no treatment is significantly different, ANOVA P = 0.97. N5 = 14, N20 = 13, N100 = 11. (B) Octopamine: no treatment is significantly different, ANOVA P = 0.23. N5 = 9, N20 = 9, and N100 = 9.

