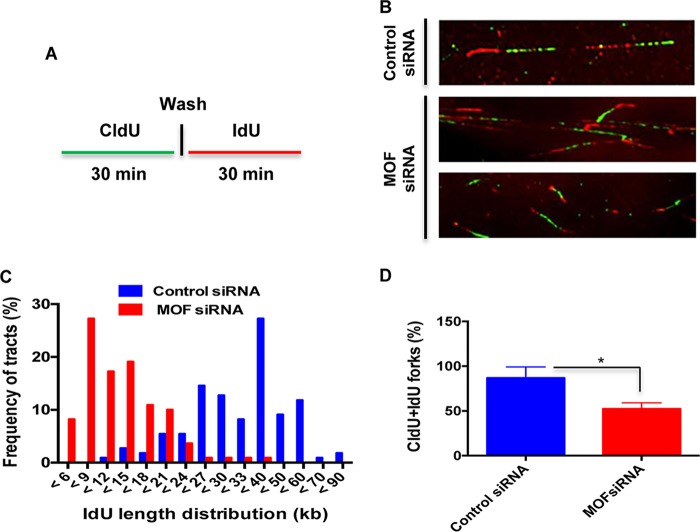
FIG 2.
Replication fork progression is impaired in MOF-depleted cells. (A) Scheme of the single DNA fiber analysis. The control and MOF-depleted HeLa cells were labeled with CldU for 30 min, rinsed, and then labeled with IdU for 30 min before being subjected to DNA fiber analysis. (B) Representative images of DNA fiber tracts in control and MOF-depleted cells. The CldU and IdU tracts were visualized in green and red, respectively. (C) Graph representing the frequency of IdU tract length distributions in control and MOF-depleted cells. (D) Bar graph showing the frequency of DNA fiber tracts with contiguous CldU and IdU labels at the replication fork. The experiments were performed three or four times, and for each time approximately 300 fibers were counted. Error bars represent the standard deviation from three independent experiments, with a P value of <0.05 (*) suggesting that the data have statistical significance.

