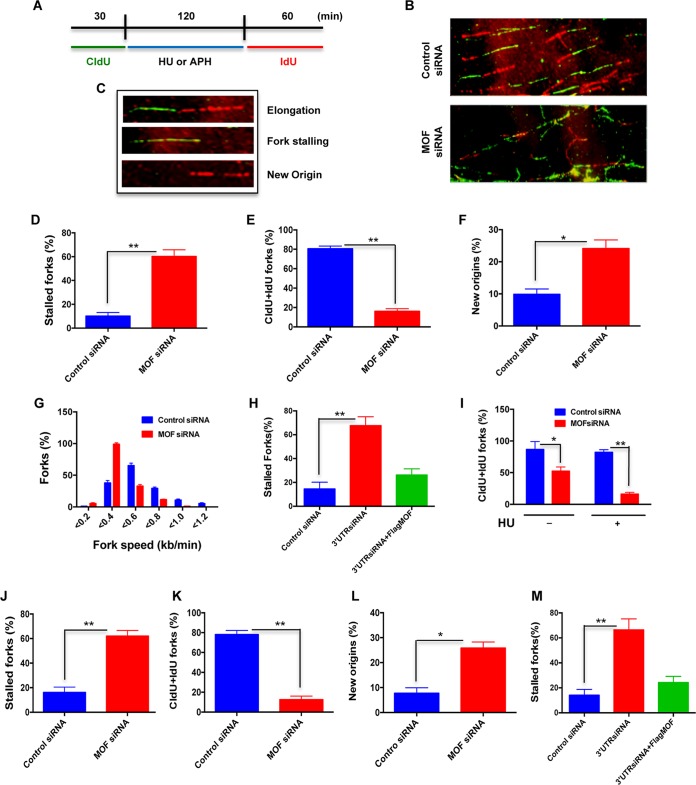
FIG 3.
Depletion of MOF decreases replication restart after replicative stress. (A) Scheme for dual labeling of DNA fibers to evaluate replication restart or recovery following HU- or APH-induced replication fork stalling. (B) Representative images of DNA fiber tracts in control and MOF-depleted cells after HU treatment. CldU tracts were visualized in green and IdU was visualized in red in control and MOF-depleted cells. (C) Examples of DNA fiber tract types representing elongation, stalled fork, and new origins. (D to G) Quantitative analysis of the DNA fiber replication restart assay after HU treatment. Bar graphs show the quantification of the percentage of stalled forks, total tracts with both CldU and IdU labels at the fork (CldU+IdU), percentage of new origins, and fork speed in control and MOF-depleted cells in panels D to G, respectively. The experiment was performed three times, and for each time point about 300 fibers were counted. Error bars represent the standard deviation from three independent experiments. P values are <0.05 (*) and <0.01 (**), showing that the values are statistically significant. (H) Quantitative analysis of replication restart after HU treatment in HeLa cells transfected with siRNA specific to the 3′ untranslated region (UTR) of the mof gene and ectopic expression of FLAG-MOF in these cells. (I) Bar graph showing the frequency of replication tracts with both CldU and IdU labels in the absence or presence of HU treatment in control and MOF-depleted cells. (J to L) Quantitative analysis of the DNA fiber assay following APH treatment. Bar graphs show the measurement of percentage of stalled forks, total tracts with both CldU and IdU labels at the fork (CldU+IdU), and percentage of new origins in control and MOF-depleted cells in panels J to L, respectively. (M) Quantitative analysis of the replication restart assay after APH treatment in cells transfected with siRNA specific to the 3′ UTR of the mof gene followed by ectopic FLAG-MOF expression.

