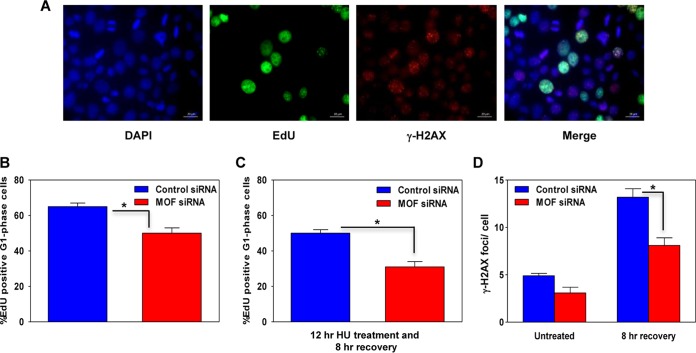
FIG 4.
Depletion of MOF delays S-phase progression. (A) Representative images of control and MOF-depleted HeLa cells coimmunostained for EdU (green) and γ-H2AX (red), with DAPI-stained nuclei in blue. (B) Graph showing the percentage of EdU-positive G1-phase cells in the asynchronous HeLa cell population in control and MOF-depleted cells after labeling with EdU for 30 min followed by growth of the cells under normal culture conditions for 8 h. (C) Quantification of the percentage of EdU-positive G1-phase cells in control and MOF-depleted cells pretreated with 1 mM HU for 12 h, followed by 8 h of recovery. (D) Numbers of large γ-H2AX foci, representing collapsed forks, in EdU-positive S-phase cells in control and MOF-depleted cells. Foci were counted in approximately 200-EdU positive cells per data set. The error bars represent the standard deviation from three independent experiments. The P value is <0.05 (*), indicating that the difference is statistically significant.

