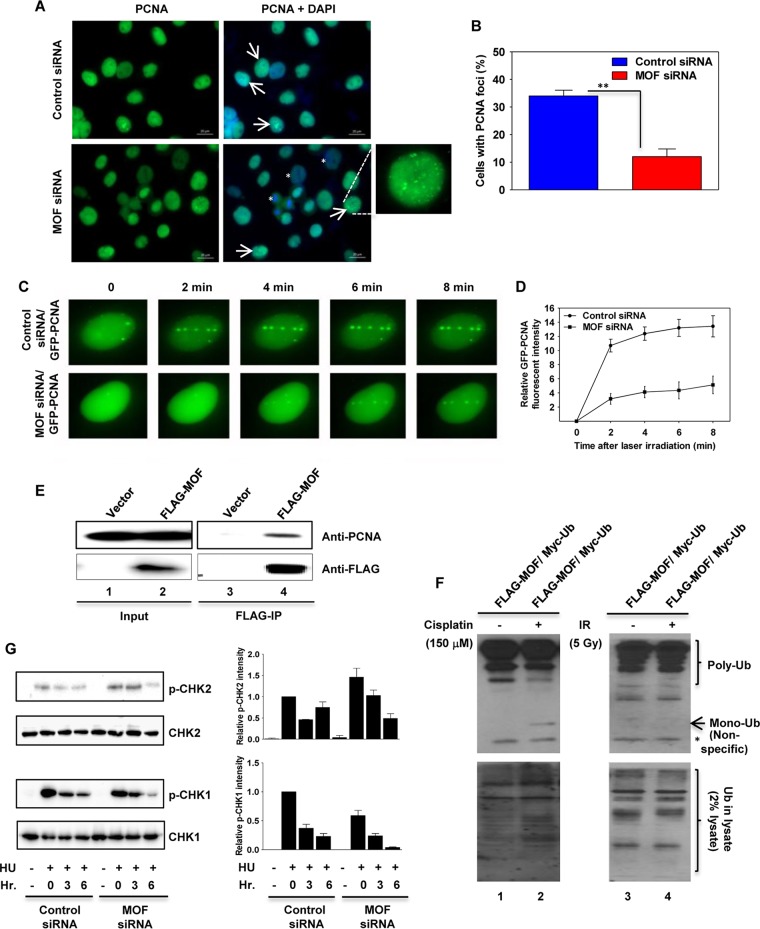
FIG 8.
MOF depletion reduces PCNA ubiquitination, delays PCNA recruitment to DNA damage sites, and inhibits CHK1 phosphorylation. (A) Recruitment of PCNA to DNA damage sites is decreased in MOF-depleted cells. Control and MOF-depleted HeLa cells were treated with HU for 24 h, and 12 h after release from HU treatment, the cells were immunostained with PCNA antibody. The cells with PCNA foci are marked with arrows. The enlarged image in the bottom right panel shows a representative image of the cells with PCNA foci. The less-PCNA-stained cells in MOF-depleted cells are marked with an asterisk. (B) Quantification of the percentage of cells with PCNA foci in control and MOF-depleted cells. Error bars represent the standard deviation from three independent experiments. P value: **, <0.01. (C) Recruitment of PCNA onto laser-induced DNA damage sites. Exponentially growing control and MOF-depleted HeLa cells were transfected with cDNA coding for EGFP-PCNA and then microirradiated, and time-lapse images were captured at different time intervals. (D) Kinetics of GFP-PCNA relative fluorescence intensity at the DNA damage sites measured in control and MOF-depleted HeLa cells at different time intervals after microirradiation. The experiments were performed two times, and each time about 50 cells was targeted with the laser and PCNA recruitment kinetics were measured. (E) FLAG-tagged MOF was used to coimmunoprecipitate endogenous PCNA (lane 4) from extracts prepared from transfected cells. The input and the IgG controls are shown in lanes 1 and 3, respectively. (F) FLAG-MOF and Myc-ubiquitin expression vectors were cotransfected into HeLa cells, followed by treatment with either cisplatin (150 μM) or IR (5 Gy). The increased PCNA monoubiquitylation induced by cisplatin is shown in lane 2. The monoubiquitinated band is marked with an arrow. The lowermost band, which is marked with an asterisk, corresponds to a nonspecific band. (G) The control and MOF-depleted HeLa cells were treated with HU and released from inhibition for the indicated times before being subjected to Western blotting with p-CHK1 and p-CHK2 antibodies. As a loading control, the same blots were reprobed with CHK1 and CHK2 antibodies. The bar graphs on the right show the Western blot quantification for the three independent experiments.

