Fig. 1.
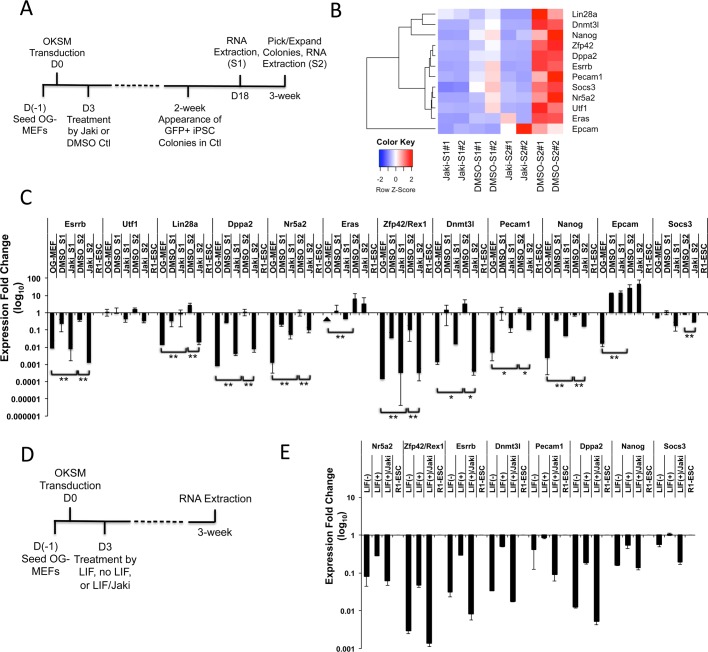
Esrrb is regulated by LIF and Jak/Stat3 activity in reprogramming. (A) Schematic diagram depicting the reprogramming process and dates (S1 and S2) for RNA-seq sample collection from reprogrammed cells. (B) Heatmap of FPKM value comparison for key pluripotent genes plus the Stat3 activity indicator Socs3 under Jaki or DMSO treatment at reprogramming stage S1 and S2. The relative abundance is indicated by color (blue, lower abundance; red, higher abundance). (C) qRT-PCR analysis of pluripotent genes in reprogrammed cells collected at Jaki or DMSO treatment at reprogramming stage S1 and S2. Values are relative to R1-ESC standard. Data are mean±s.d. from three independent biological repeats. The arrowhead indicates that expression was not detected. *P<0.05, **P<0.01. (D) Schematic diagram depicting the reprogramming process and dates for the LIF-deprivation MEF reprogramming experiment. (E) qRT-PCR analysis of pluripotent genes in reprogrammed cells with or without LIF, or with LIF plus Jaki treatment at a 3-week time point. Values are relative to R1-ESC standard. Data are mean±s.d. from two independent biological repeats.

