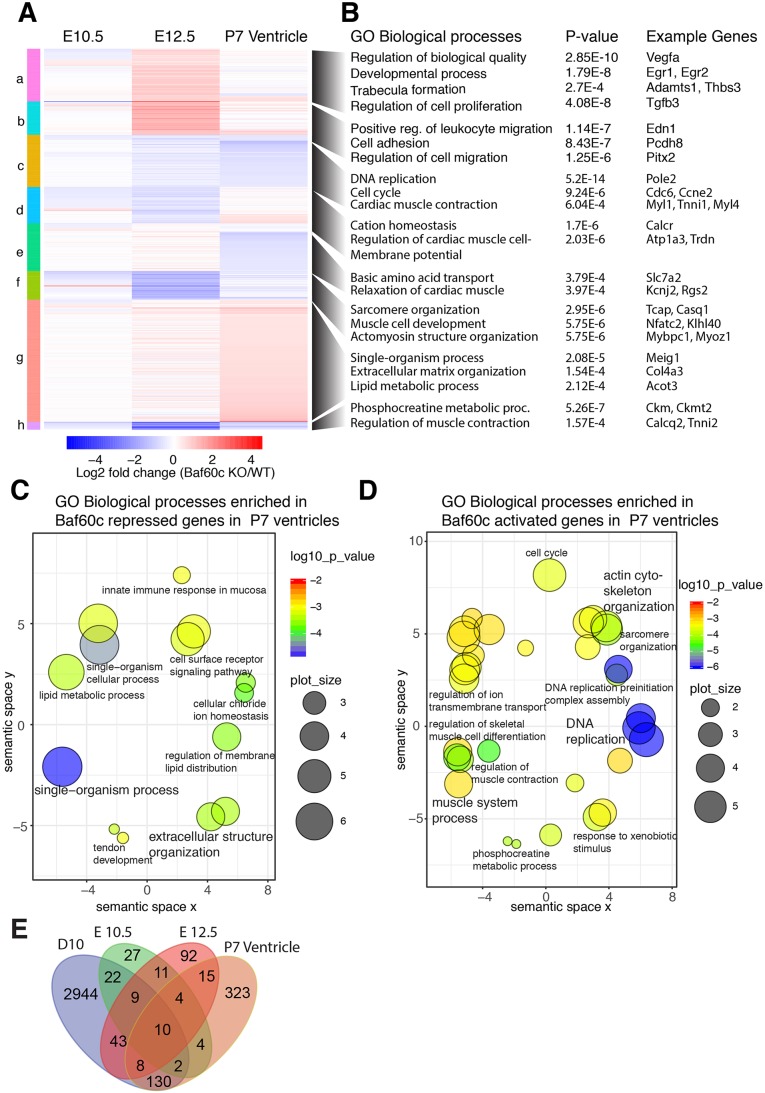
Fig. 6.
BAF60c transcriptionally affects cardiac morphogenesis and function. (A) Heat map comparing genes affected by Baf60c loss in embryonic hearts (E10.5 and E12.5) and postnatal ventricles [postnatal day (P)7]. Significantly affected (≥1.25-fold, P<0.05, Useq test, n=3) genes in at least any one stage were selected and clustered. (B) Gene ontology (GO) biological processes enriched in each of these clusters and example genes in that category are shown. (C,D) Genes repressed (C) or activated (D) by Baf60c in P7 ventricles were analyzed for enrichment of GO biological processes and are plotted. The color of circles represents P-value of enrichment and size represent the size of the GO term. (E) Venn diagram showing genes misregulated in absence of Baf60c in embryonic heart at E10.5, E12.5 and P7 ventricle and compared cardiac myocyte (Day 10) stages of in vitro directed cardiac differentiation.

