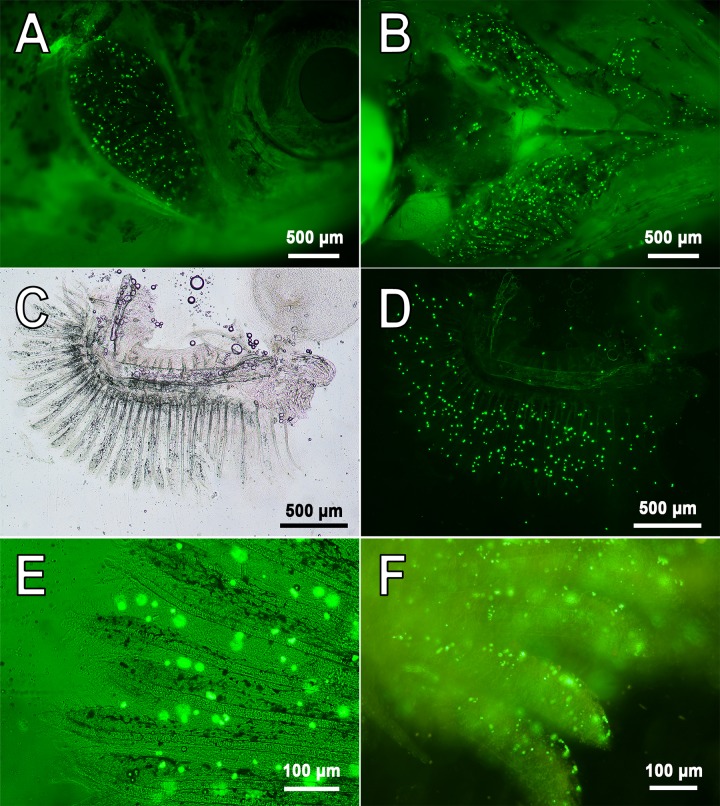
Fig. 2.
Representative images of PMs-PEG in capillaries of zebrafish gills. (A-E) 7 days following injection of PMs-PEG into the fish kidney. (F) 1 day following retro-orbital injection. A shows side view; B shows bottom view; C-F show isolated gill arches. Fluorescent images of PMs-PEG are obtained in green channel.

