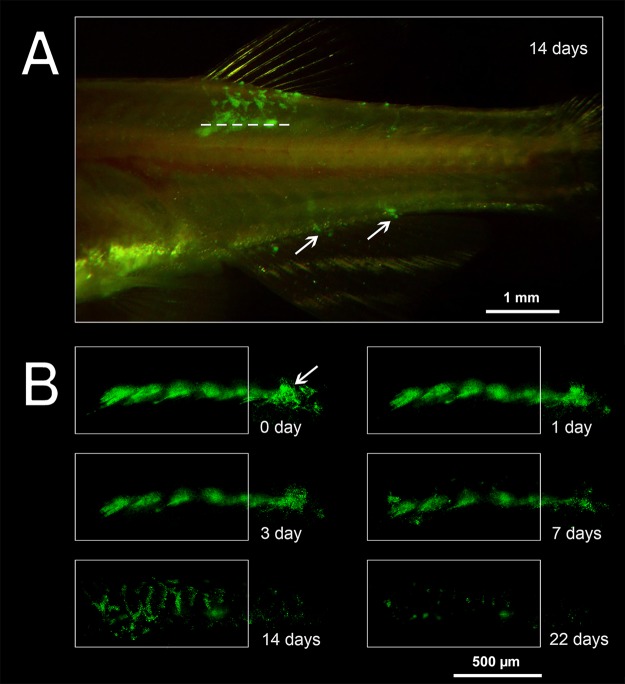
Fig. 4.
Migration of PMs-PEG from the injection tract following intramuscular injection. (A) Representative image of D. rerio 14 days following the intramuscular injection of PMs-PEG (dotted line corresponds to the injection tract). The arrows indicate fluorescence at the base of the anal fin rays. (B) Changes in the shape and area of FITC fluorescence in fish muscles. The frame indicates the analyzed region (see Fig. 5); the arrow marks the needle puncture inlet. Fluorescent images of PMs-PEG are obtained in green channel.

