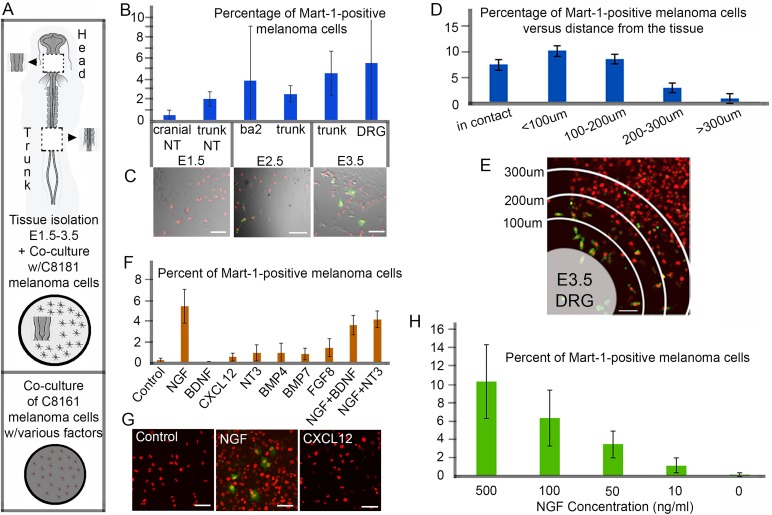
Fig. 2.
Identification of E3.5 chick dorsal root ganglia tissue and nerve growth factor (NGF) drive Mart-1:GFP expression in human C8161 melanoma cells. (A) Schematic of co-culture assays using plated human C8161 human melanoma cells with either varying ages and regions of chick embryonic tissues from the head or trunk (top) or soluble factors (bottom). (B) Percentage of Mart-1:GFP-positive C8161 melanoma cells after co-culture with different ages and regions of chick embryonic tissues (E1.5 cranial nt, 0.5±0.5%, s.d.; E1.5 trunk nt, 2.1±0.7%, s.d.; E2.5 ba2, 3.9±5.5%, s.d.; E2.5 trunk, 2.6±0.8%, s.d.; E3.5 trunk, 4.7±2.2%, s.d.; E3.5 DRG, 5.68±9.5%, s.d.). One section/piece of tissue was added per well of cells (8-well chamber slide format). Experiment was repeated in triplicate. (C) Typical images of C8161 melanoma cells (pre-labeled with H2B-mCherry, red) co-cultured with successive ages of trunk tissues, E1.5 (left), E2.5 (middle), and E3.5 (right) show an increase in Mart-1:GFP re-expression (green) with age. (D) Percentage of Mart-1:GFP-positive melanoma cells versus distance from the tissue (in contact with tissue 7.7±2.1 μm, s.d.; ≤100 μm, 10.5±3.3 μm, s.d.; 100-200 μm, 8.8±3.4 μm, s.d.; 200-300 μm, 3.1±2.7 μm, s.d. and >300 μm, 0.8±0.7 μm, s.d.). Experiment was repeated in triplicate. (E) A typical image of C8161 melanoma cells (pre-labeled with H2B-mCherry, red) co-cultured with E3.5 DRG (bottom left in E) show higher Mart-1:GFP re-expression closer to transplanted DRG tissue (100 μm increments from the edge of the tissue are labeled). (F) Percentage of Mart-1:GFP-positive C8161 melanoma cells in the presence of individual soluble factors (Control, no factor 0.2±0.2%, s.d.; NGF, 5.46±1.65%, s.d., P<0.01; BDNF, 0.05±0.04%, s.d., P=0.2; CXCL12, 0.5±0.4%, s.d., P=0.3; NT3, 0.9±0.8%, s.d., P=0.3; BMP4, 0.93±0.9%, s.d., P=0.1; BMP7, 0.8±0.58%, s.d., P=0.1; FGF8, 1.4±0.86%, s.d., P=0.7; NGF+BDNF, 3.6±0.9%, s.d.; NGF+NT3, 4.17±0.8%, s.d.) typically found in E3.5 trunk tissue. Experiment was repeated in triplicate. (G) A typical image of C8161 melanoma cells (pre-labeled with H2B-mCherry, red) in the presence of no factor (left), NGF (middle) and Cxcl12 (right) and Mart-1:GFP re-expression (green). (H) Percentage of Mart-1:GFP-positive C8161 melanoma cells exposed to different concentrations of NGF (500 ng/ml, 10.3±4.03%, s.d., P<0.01; 100 ng/ml, 6.3±3.1%, s.d., P=0.2; 50 ng/ml, 3.4±1.5%, s.d., P=0.02; 10 ng/ml, 1.1±0.8%, s.d., P=0.1; 0 ng/ml, 0.1±0.2%, s.d.). Experiment was repeated in triplicate. Scale bars: 50 μm. All calulations performed on fixed samples. Statistical analysis was performed using Student's t-test.

