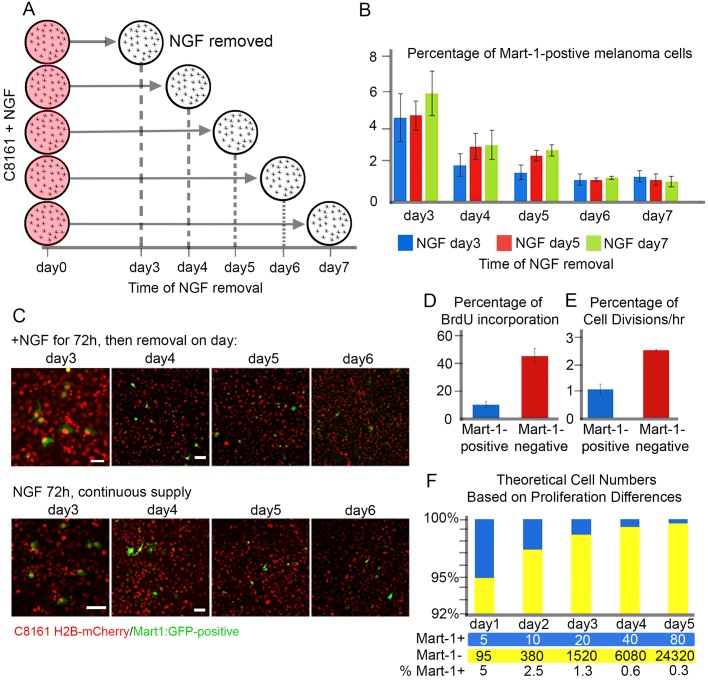
Fig. 4.
NGF induces stable Mart-1:GFP-positive C8161 melanoma cell population. (A) Schematic of the NGF time course experiment. At day 0, all plates of C8161 cells received NGF (circles shaded red) and cultured for at least 3 days before removal of NGF (white circle). On successive days (x-axis) the NGF was removed. (B) Percentage of Mart-1:GFP melanoma cells in the presence of NGF for at least 3 days and then removal on day3 (blue), day 5 (red), day 7 (green). Within each day, no data set was significantly different from the others (Day 3: NGF 3 days=4.6±1.3%, s.d.; NGF 5 days, 4.7±0.8%, s.d.; NGF 7 days, 5.9±1.2%, s.d.; Day 4: NGF 3 days, 1.8±0.6%, s.d.; NGF 5 days, 3±0.7%, s.d.; NGF 7 days, 3.1±0.8%, s.d.; Day 5: NGF 3 days, 1.6±0.4%, s.d.; NGF 5 days, 2.5±0.3%, s.d.; NGF 7 days, 2.8±0.3%, s.d.; Day 6: NGF 3 days, 1.2±0.3%, s.d.; NGF 5 days, 1.2±0.1%, s.d.; NGF 7 days, 1.3±0.1% s.d.; Day 7: NGF 3 days, 1.37±0.3%, s.d.; NGF 5 days, 1.2±0.3%, s.d.; NGF 7 days, 1.1±0.3%, s.d.; at least 1000 cells counted per condition; each condition repeated in duplicate). (C) (Top Panel) C8161 melanoma cells after co-culture with NGF for 3 days (72 h) show ∼5% Mart-1:GFP-positive melanoma cells, then removal on subsequent days. A decrease in Mart-1:GFP-positive melanoma cells is seen on subsequent days (4-6). (Bottom Panel) C8161 melanoma cells maintained in culture with constant supply of NGF show same ∼5% Mart-1:GFP-positive melanoma cells at day 3 and similar decrease in Mart-1:GFP-positive cells at days 4-6. (D) Proliferation rate of C8161 melanoma cells changes after Mart-1:GFP expression. Percentage of BrdU incorporation in C8161 cells after 30 min BrdU pulse: Mart-1:GFP-positive melanoma cells, 10±2.3% (s.d.) and Mart-1:GFP-negative melanoma cells, 45.5±3.4% (s.d.), P<0.01 (left graph; n>500 cells counted per condition, experiment run in duplicate). (E) Time-lapse culture analysis shows Mart-1 positive cells proliferate less (1.1±0.4 cell divisions per hour) than Mart-1-negative cells [2.56±0.3 (s.d.) cell divisions per hour], P<0.01. n=4 time lapses per condition. (F) Theoretical calculation of cell populations based on differences in proliferation dynamics. After NGF exposure, ∼5% of C8161 melanoma cells re-express Mart-1:GFP and the cell proliferation rate decreases. A doubling rate of 2 (cell cycles in 24 h) is applied to the Mart-1:GFP-positive cell population starting with 5 out of 100 cells and a rate of 4 (cell cycles in 24 h) is applied to the Mart-1-negative population starting at 95 out of 100 cells. Using a 24-h doubling time, the projected changes in cell population distribution are seen by a decrease in blue cell (Mart-1:GFP-positive) and increase in yellow cell (Mart-1:GFP-negative) populations. Scale bars: 50 μm. All calculations performed on living samples. Statistically analysis was performed using Student's t-test.

