Fig. 6.
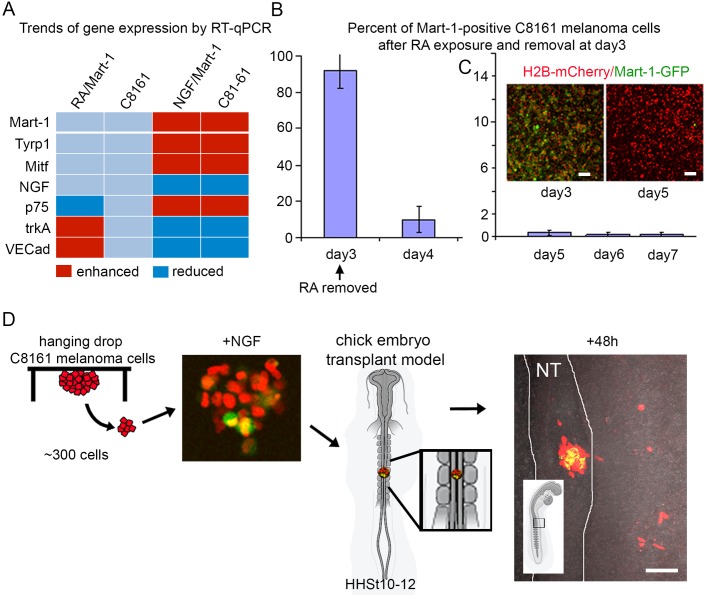
Gene profiling and phenotypic analysis of NGF versus RA-induced Mart-1:GFP-positive C8161 melanoma cells. (A) Gene expression comparison of Mart-1:GFP-positive C8161 metastatic melanoma cells after RA and NGF exposure compared to wild-type C8161 metastatic melanoma cells (light blue) and C81-61 non-metastatic melanoma cells. Increased (shown in red) and decreased (shown in dark blue) expression above/below wild-type levels (shown in light blue) are based on qPCR values. (B) C8161 metastatic melanoma cells in the presence of RA for 3 days show nearly all cells express Mart-1:GFP (93±8.4%, s.d.), and only 8.1±6.7% (s.d.; P<0.01) 24 h after removal of RA (day 4). Experiment was repeated in duplicate. (C) Further decline in Mart-1:GFP expression continues after RA removal, analyzed on days 5-7. (C, inset) C8161-H2B:mCherry/Mart-1:GFP-positive melanoma cells after 3 days of RA exposure (left panel), and 48 h after RA removal (right panel). Day 5=0.34±0.26 s.d., day 6=0.21±0.19% s.d., day 7=0.2±0.2 s.d. (D) Schematic of hanging drop culture of C8161 melanoma cells pre-labeled with H2B-mCherry and then exposed to NGF to induce ∼5% Mart-1:GFP re-expression and transplanted into the chick neural tube at HHSt12. After 48 h of egg re-incubation, C8161 melanoma cell positions were analyzed and included cell invasion into the periphery away from the outline of the neural tube transplant site or remained at the transplant site. Mart-1:GFP-positive cells appeared to be confined to the initial transplant site within the neural tube. n=5 embryo transplants. NT, neural tube. Scale bars: 50 μm. Calculations done on living samples (B,C). Statistical analysis was performed using Student's t-test.

