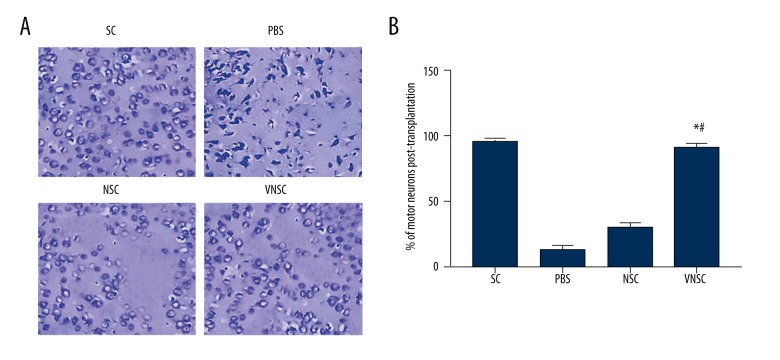
Figure 2.
Motor neuron regeneration post-transplantation. (A) Positive Nissl staining demonstrated the number of motor neurons. There was a significant increase in the number of neurons following VNSC transplantation compared to NSC-transplanted groups. PBS transplanted groups had the greatest neuronal loss. (B) Quantification of number of neurons. The quantification was performed by counting the number of positively stained neurons (with intact cell body) in each group and is expressed as percentages relative to the total number of cells in the examined tissue section. Values are represented as mean ±SEM, * p<0.05 compared to PBS transplanted group; # p<0.05 compared to normal NSC-transplanted group.

