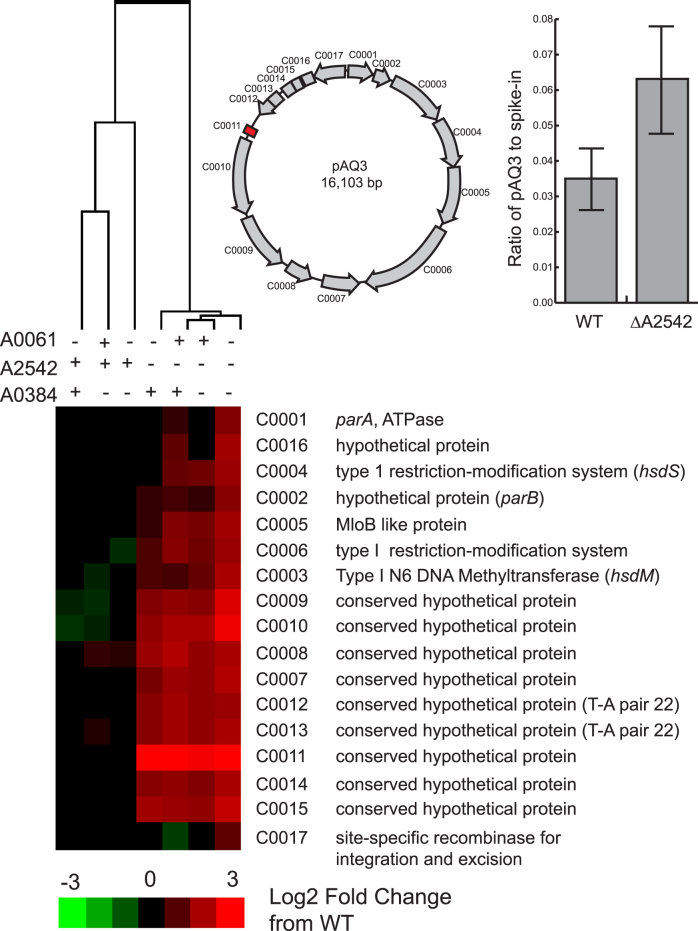
Figure 3.
Heatmap of gene expression of coding sequences on pAQ3 in RNase III mutants compared to WT. Log2 fold change data for each gene was clustered using Cluster 3.0 (hierarchical clustering, correlation uncentered, centroid linkage). Genes not meeting the FDR cutoff (<0.005) were given a value of zero. A schematic of the coding sequences on pAQ3 and their locations and orientations is shown. There was a significant difference in pAQ3 levels compared to a DNA spike-in are shown for WT and ΔA2542 (P < 0.05, Student's t-test, two-sided, equal variance, n = 4). Averages are shown with the error bars showing the standard deviation.

