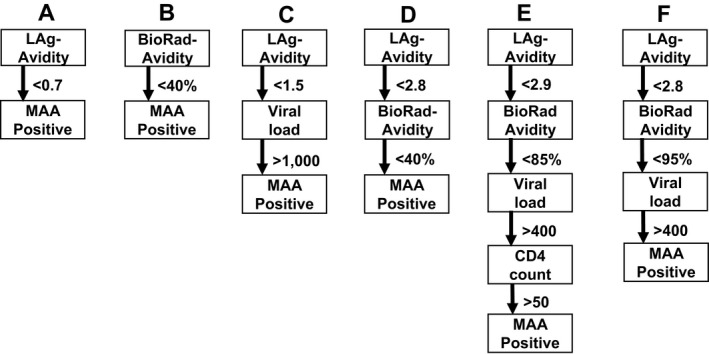
Figure 1.

Assays and multi‐assay algorithms for cross‐sectional HIV incidence estimation. The figure shows the assays and cutoff used for six different testing methods: two individual assays, the LAg‐Avidity assay (A) and the BioRad‐Avidity assay (B), the current testing algorithm recommended for the LAg‐Avidity assay (C), two MAAs previously optimized for incidence estimation in subtype B settings (D and E), and the optimal subtype C MAA identified in this report (F). The units used for the assays were: LAg‐Avidity assay: normalized optical density units (OD‐n): BioRad‐Avidity assay: avidity index (%); viral load: HIV RNA copies/mL; CD4 cell count: cells/mm3. Individuals with the following results were classified assay‐ or MAA‐positive: (A) LAg‐Avidity <0.7 OD‐n; (B) BioRad‐Avidity <40%; (C) LAg‐Avidity <1.5 + viral load (VL) >1,000; (D) LAg‐Avidity <2.8 OD‐n + BioRad‐Avidity <40%; (E) LAg‐Avidity <2.9 OD‐n + BioRad‐Avidity <85% + VL >400 + CD4 > 50; (F) LAg‐Avidity <2.8 OD‐n + BioRad‐Avidity <95% + VL >400.
