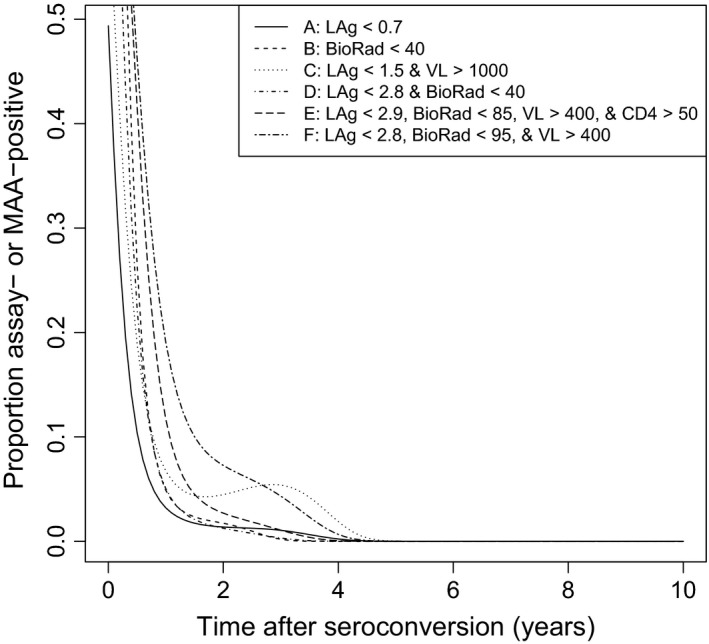
Figure 2.

Modeled probabilities of an individual being classified as assay‐ or MAA‐positive as a function of duration of infection. The figure shows modeled probability curves of samples being classified as assay‐positive using the LAg‐Avidity assay or BioRad‐Avidity alone, or multi‐assay algorithm (MAA)‐positive using one of four MAAs.
