
FIGURE 3.
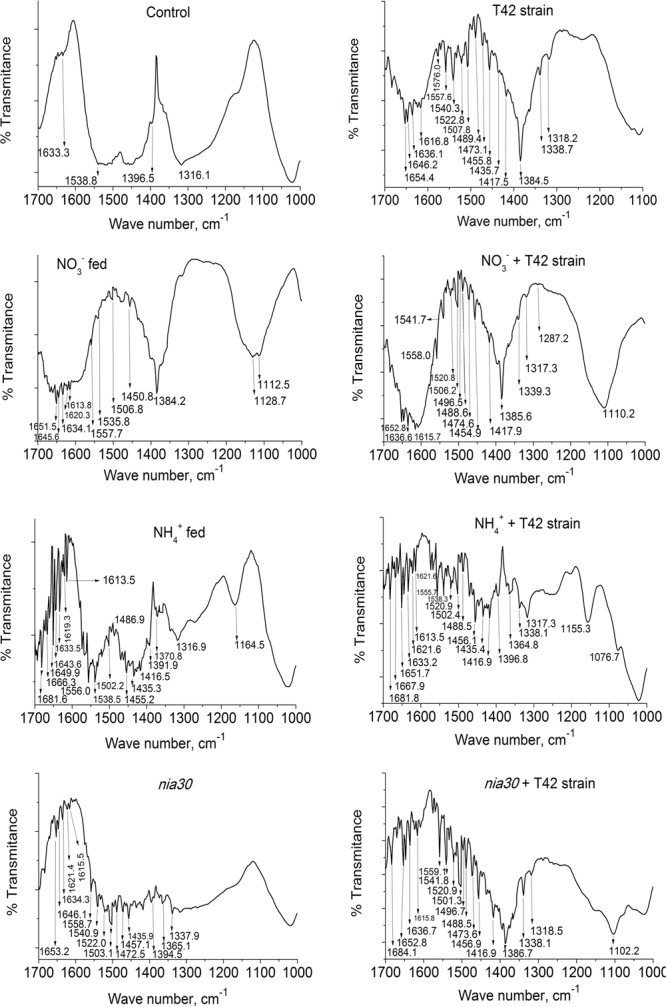
FT-IR spectrum in tobacco roots. Pictorial representation of different signal peaks lies in the range of wave number 1700–1000 cm-1 in tobacco root with different treatments: control (used distilled water), T42 strain treated, NO3- fed, NO3- fed plus T42 bio-primed, NH4+ fed, NH4+ fed plus T42 bio-primed, nitrate reductase mutant; nia30 and nia30 bio-primed with T42 strain at 70 days after treatment. Values are represented as % transmittance.