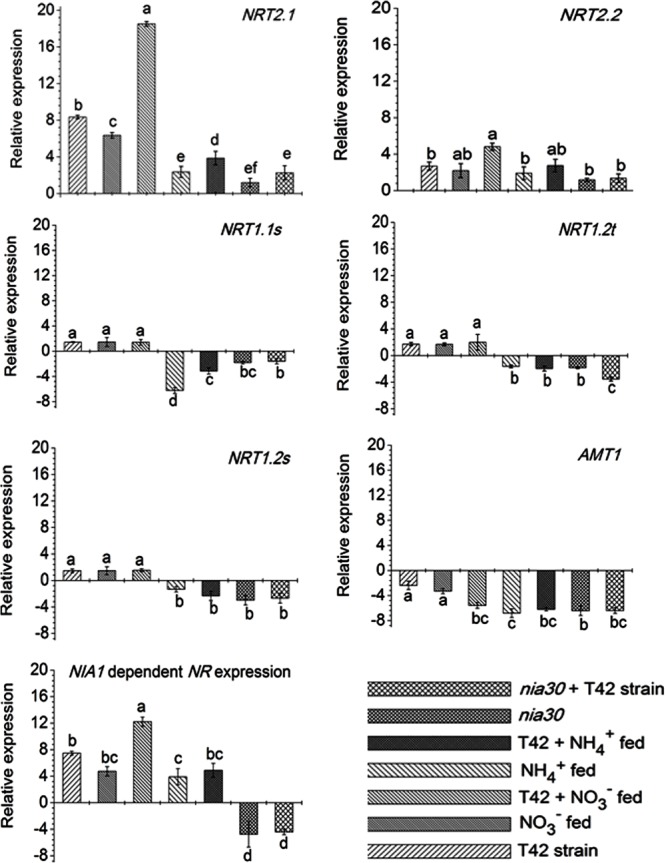
FIGURE 7.

Transcript level of high affinity nitrate transporters (NRT2.1 and NRT2.2), low affinity transporters (NRT1.1s, NRT1.2s, and NRT1.2t), ammonium transporter (AMT1) and NR involved in N uptake in roots. Bars represent as SD (Standard Deviation) from means of three biological replicates. Different letters on bars show significant differences as analyzed by Duncan’s multiple rang test (at P < 0.01).
