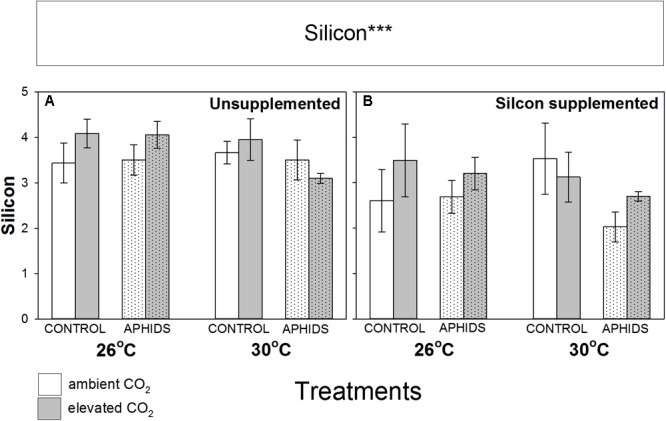
FIGURE 3.

Impacts of CO2, temperature and aphid presence on Si concentrations of M. sativa foliage (% dry mass) when growing in (A) non-supplemented and (B) Si supplemented soil. Mean values ± standard error shown (N = 9) with statistically significant effects indicated ∗∗∗P < 0.001. Significant factors shown as per Figure 1 legend.
