Figure 3.

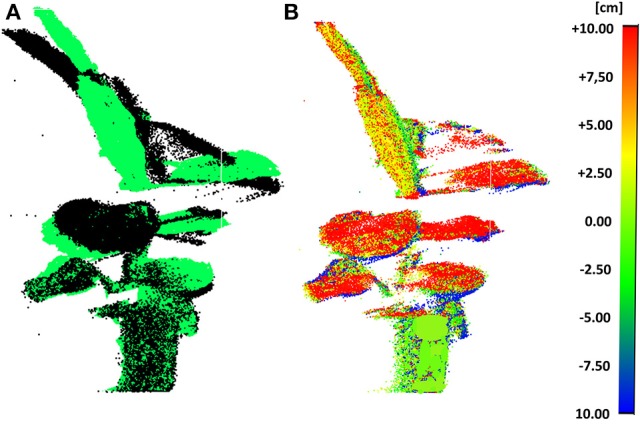
Scans at 7.00 a.m. and at 12.30 p.m. of plant 1 during test A: superimposed (7.00 a.m. in black color and 12.30 p.m. in green color) (A) and deviation map (B).

Scans at 7.00 a.m. and at 12.30 p.m. of plant 1 during test A: superimposed (7.00 a.m. in black color and 12.30 p.m. in green color) (A) and deviation map (B).