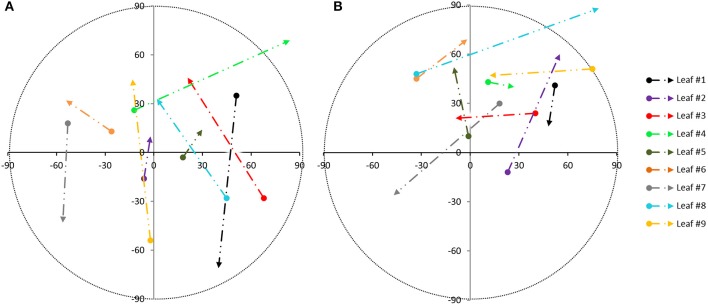
Figure 5.
Movement pattern from individual leaves of plant 1, based on the angle orientation change within sampling periods: during test A (A) and during test B (B) [azimuth changes on x axis and vertical angle changes on y axis from 7.00 a.m. to 12.30 p.m. (beginning of the arrow) and from 12.30 p.m. to 6.00 p.m. (end of the arrow)].

