Figure 4.
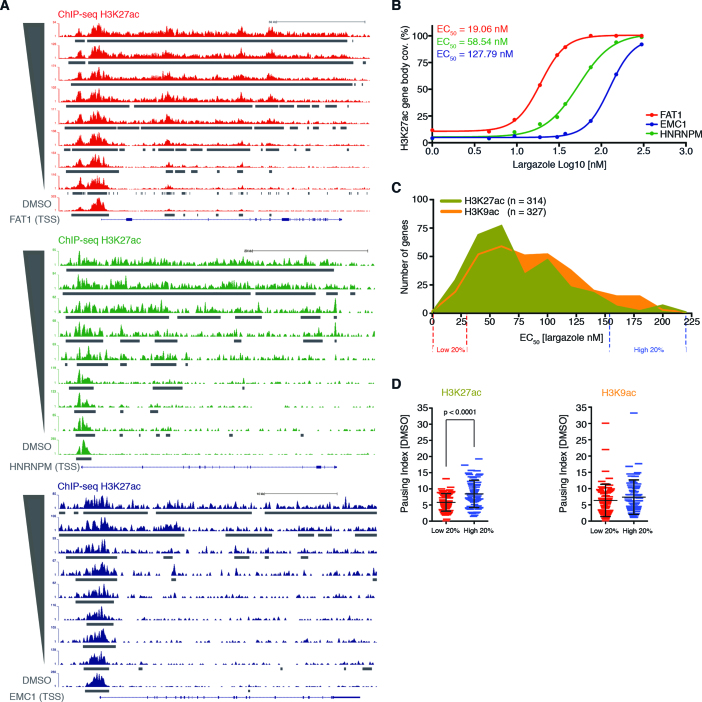
Correlation between histone acetylation signal spread sensitivity along gene bodies and pausing index. (A) Snap shots from UCSC Genome Browser showing H3K27ac ChIP-seq signal over three different gene regions illustrate different dose-dependent acetylation of H3K27; low dose (red), mid dose (green), and high dose responders (blue). (B) EC50 values calculated by dose response plots of the normalized H3K27ac gene body coverage (FStitch signal) for the three genes in (A). (C) Histograms showing the distribution of EC50 values, for both H3K27ac (green) and –K9ac (orange), associated with a set of selected gene regions. (D) Student's unpaired t-test analysis between the calculated RNAPII pausing indexes from genes with the lowest (20%) and highest (20%) EC50 values determined from the histogram shown in (C). Individual genes with associated PI are plotted and the mean and standard deviation are shown with black horizontal lines.

