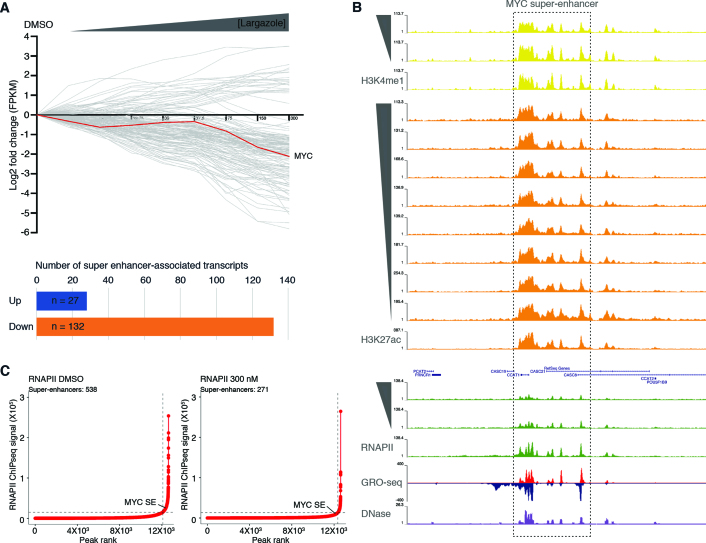
Figure 6.
Dose dependent largazole-induced depletion of RNAPII occupancy at most individual elements within super-enhancer regions. (A) Graph illustrates the log2 fold change in mRNA accumulation from HCT116 cells treated for 16 h in the absence (DMSO) or presence of increasing concentrations of largazole (4.7–300 nM). Each grey line depicts the trend of an individual gene transcript, with upregulated mRNAs (log2 > 1) shown above the black horizontal line and below those downregulated (log2 < –1). Distribution of total number of SE-associated transcripts differentially expressed under largazole. (B) Screenshot of Genome Browser (UCSC) along the MYC super enhancer (SE #34241) (30) showing normalized ChIP-seq data in untreated (DMSO) or increasing largazole dose treatment of HCT116 cells targeting H3K4me1, H3K27ac and RNAPII. GRO-seq signal (red and blue) from (24) and the associated DNAse I hypersensitivity peak clusters from ENCODE under basal conditions (www.encodeproject.org). (C) Delineation of super-enhancers based on RNAPII occupancy in untreated and largazole exposed HCT116 cells using the ROSE algorithm (31,40).

