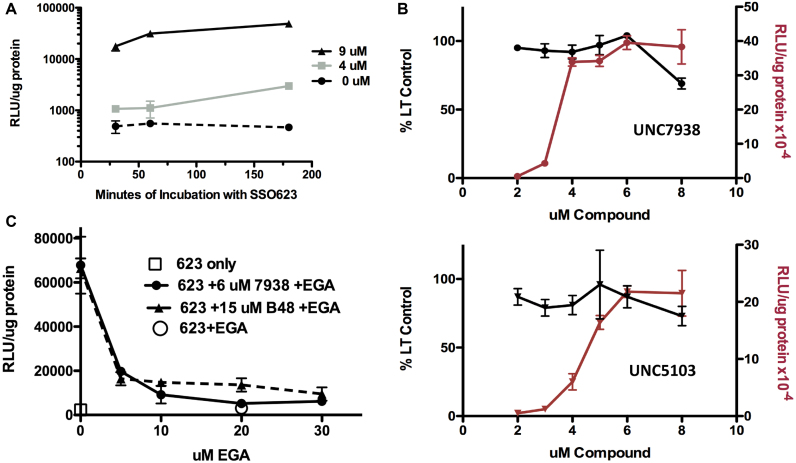
Figure 4.
Subcellular Mechanism. Several approaches were used to more explicitly delineate the subcellular locus of action of the OECs. (A). Kinetics of the OEC Effect. Cells were incubated with 500 nM SSO623 for various periods, rinsed and then treated with 0, 4 or 9 μM UNC7938 for 30 min. After an additional two rinses the cells were incubated in medium for 3 h to allow luciferase expression. Means and SE. N = 3. (B) Comparison of OEC Effects on Lysotracker Accumulation and Luciferase Induction. In parallel experiments using the same stocks of compounds, dose-effect curves were established for inhibition of Lysotracker accumulation (black lines) and for induction of luciferase (red lines). A narrow concentration range was chosen so as to be able to examine the detailed profiles. The incubation conditions for the SSO and for the OECs were the same as for Figure 1. Lysotracker Red was used at 200 nM. Means and SE. N = 3. (C) EGA Inhibition of the Effect of OECs. Cells were pre-incubated with various concentrations of EGA for 15 min. The cells were then treated with 500 nM SSO623 in the presence of EGA for 1 h. Cells were rinsed and then treated with 6 μM UNC7938 or 15 μM B-48 in the presence of EGA for 1 h and then rinsed 2× in medium. Cells were then incubated for 3 h in medium followed by processing for luciferase induction. Means ± SE. N = 3.

