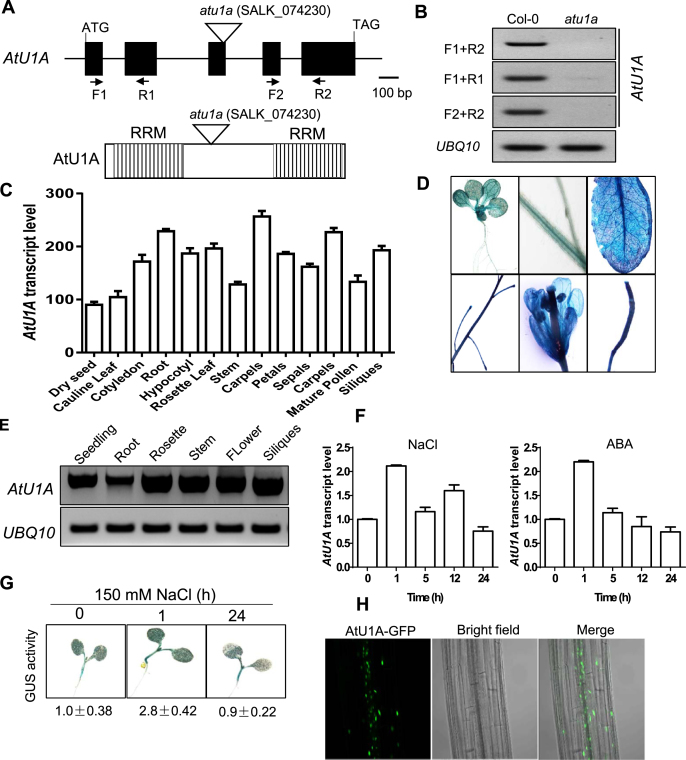
Figure 2.
Expression profiles of AtU1A and its protein subcellular localization. (A) Structure of the AtU1A gene. Exons and introns are illustrated with black boxes and black lines, respectively. The triangle indicates the T-DNA insertion. Positions of primers used for RT-PCR analysis in (B) are included. Shown also are the two RRM in AtU1A. (B) RT-PCR analysis of AtU1A expression in the atu1a mutant. (C) Expression of AtU1A in wild-type plants at different developmental stages as indicated by publicly available gene expression data (30). (D) AtU1Apro:GUS reporter gene expression. T2 transgenic plants expressing GUS under the control of the AtU1A promoter were stained with X-Gluc and and examined and imaged with a microscope. (E) RT-PCR analysis of AtU1A expression level in different tissues of wild-type plants. (F) Transcript level of AtU1A in response to salt and ABA treatments. (G) AtU1Apro:GUS reporter gene expression in response to salt. The 7-day-old T3 transgenic plants were treated or not treated with 150 mM NaCl for the indicated times and were then stained with X-Gluc and examined and imaged with a microscope. GUS activities were determined by measuring fluorescence with a Tecan 200 fluorometer using 360 and 465 nm as excitation and emission wavelengths, respectively. The GUS activity under control conditions was set to 1. (H) Subcellular localization of AtU1A. The 7-day-old transgenic plants harboring the AtU1A-GFP construct were examined with a confocal microscope. UBQ10 was used as an internal control in (B and E) and (F). Error bars represent SD (n = 3 in [C] and [F]).

