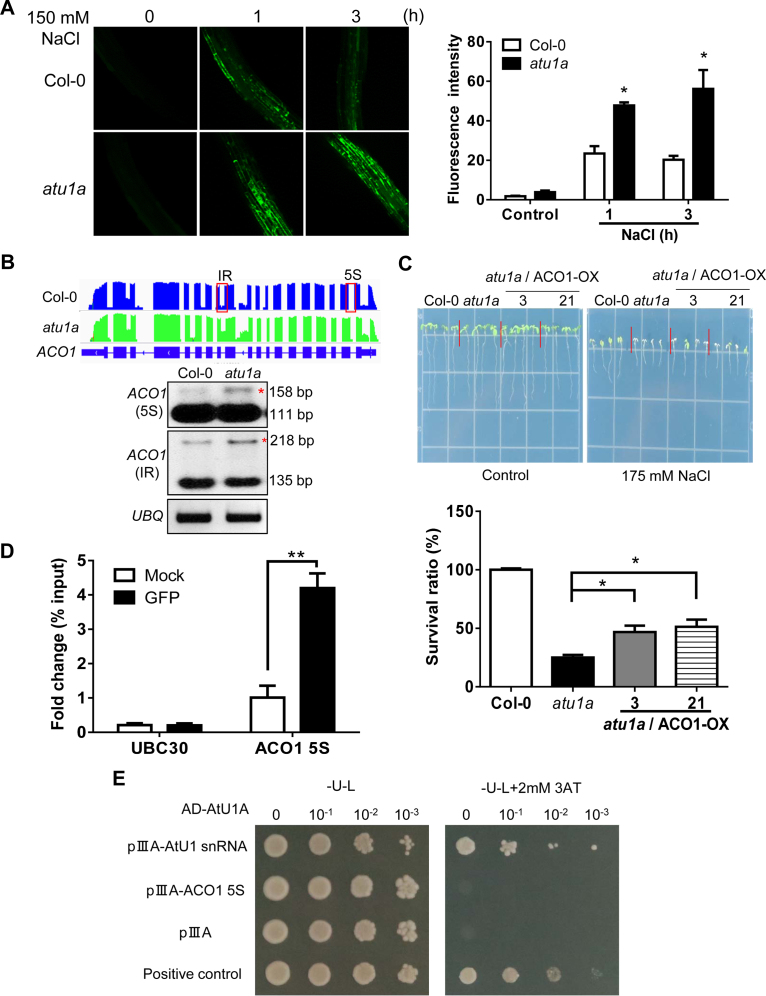
Figure 6.
The atu1a mutant plants accumulate more ROS than wild-type plants under salt and have abnormally AS transcripts of ACO1. (A) Representative images of ROS production (determined by staining with the fluorescent dye H2DCF-DA) in root tips and root elongation zones after treatment with 150 mM NaCl for the indicated times. Quantification of ROS production based on fluorescence pixel intensity (right panel). Error bars indicate SD (n = 30 [number of seedlings]). (B) ACO1 is mis-spliced in the atu1a plants under salt stress. Shown are results from RNA-seq (graphic display in the upper panel) and RT-PCR analysis (lower panel). (C) Growth of transgenic lines overexpressing ACO1 in the atu1a mutant in response to salt (upper panel) and survival rates of these plants under salt stress (lower panel). (D) RNA-IP analysis of the association of AtU1A with the pre-mRNA of ACO1 5S, and UBC30. (E) Direct selection for RNA–protein interaction. The pAD-AtU1Aand plllA/MS2-2 (AtU1 snRNA or pre-mRNA of ACO1 5S) plasmids were co-transformed into L40-coat yeast and plated on a medium lacking leucine and uracil and containing 2 mM 3-aminotriazole. The empty vector plllA/MS2-2 and pAD-AtU1A were co-transformed into yeast and used as a negative control. The plllA/IRE-MS2 vector and pAD-IRP were co-transformed into yeast and used as a positive control. Error bars indicate SD (n = 16 in [C], 3 in [D]). Asterisks indicate significant differences (*P < 0.05, **P < 0.01) as determined by a two-tailed paired Student's t-test.

