Figure 7.
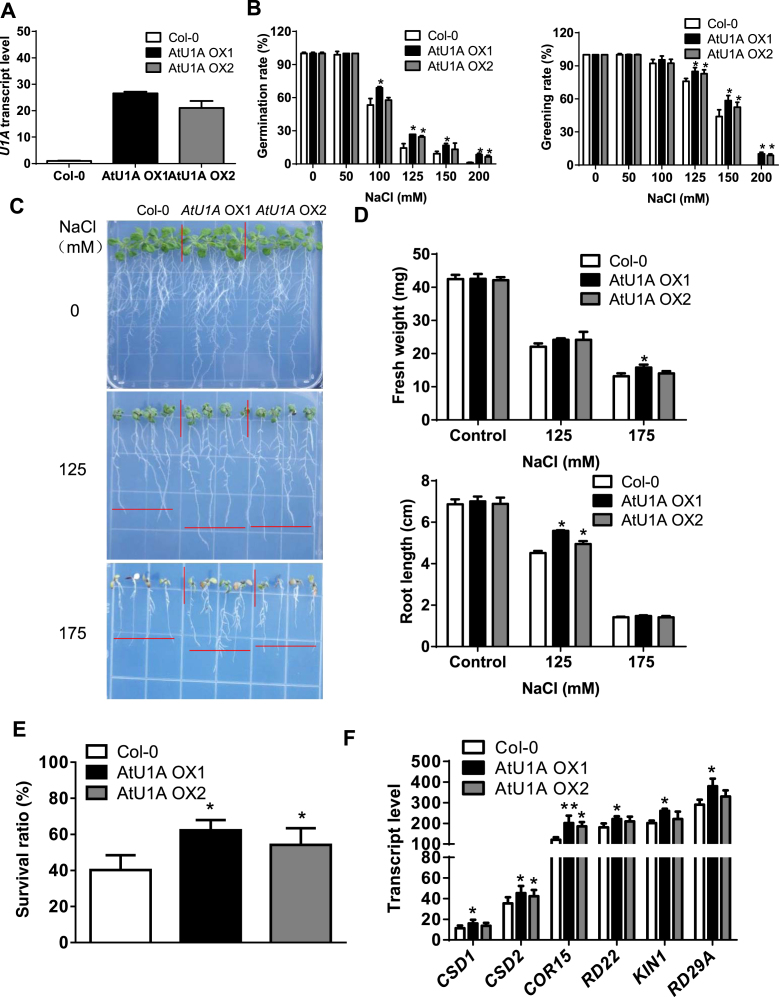
Overexpression of AtU1A confers salt tolerance. (A) Transcript level of AtU1A in two AtU1A overexpression lines. (B) Seed germination and seedling greening of wild-type and two AtU1A overexpression plants under salt stress. (C) Growth of the wild-type (Col-0) and two AtU1A overexpression lines in response to salt stress. The 4-day-old seedlings grown on MS medium were transferred to MS medium containing different levels of NaCl and were allowed to grow for additional 10 days. Representative plants were photographed. (D) Fresh weights (upper panel) and root elongation (lower panel) of plants shown in (C). (E) Survival (shown as a percentage of survival on normal medium) ratio of soil-grown wild-type and two AtU1A overexpression plants under salt stress. The 14-day-old seedlings grown in soil were irrigated with 300 mM NaCl and allowed to grow for additional 10 days. (F) Transcript levels of ROS detoxification- or stress-related genes in wild-type and two AtU1A overexpression plants under salt stress. UBQ10 was used as an internal control in [A] and [F]. Error bars represent SD (n = 3 in [A and F], 100 [number of seeds or seedlings] in B, 16 in D, 48 in E). Asterisks indicate significant differences (*P < 0.05, **P < 0.01) as determined by a two-tailed paired Student's t-test.

