Figure 3.
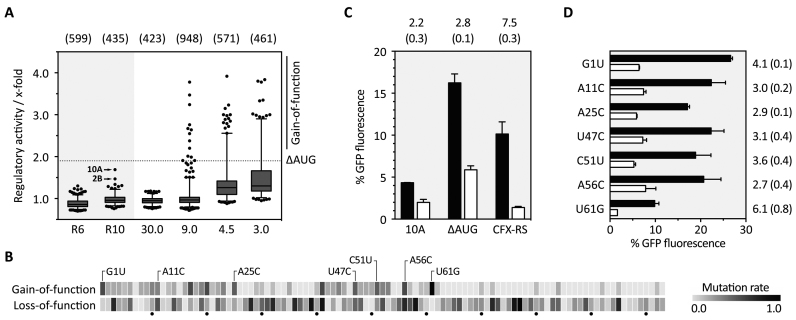
In vivo screening for CFX riboswitches and refinement of the aptamer domain. (A) The boxplot summarizes the in vivo screening in S. cerevisiae for round 6 (R6) and round 10 (R10) and the screened doped pools with different degrees of randomization, starting with 30.0% (30.0) down to 3.0% (3.0). For each investigated clone, the regulatory activity was calculated as ratio of GFP fluorescence with and without 1 mM CFX (x-fold). The two regulatory active sequences 2B and 10A are highlighted. Based on 10A, a mutant was derived with a mutated AUG that was upstream of the original start codon (ΔAUG) and used for synthesizing four doped libraries (30.0–3.0%). Clones that showed better switching properties than ΔAUG (dotted line) were sorted into the gain-of-function group. The numbers written above the boxplot indicate the number of clones used for the particular box. (B) Heatmap based on sequencing the gain- and loss-of-function group. For each group, mutation rate was normalized to 1.0 and plotted as a heatmap as per-nucleotide function. Highlighted point mutations in the gain-of-function group are considered as directed mutations. All single data can be found in Supplementary Table S8. (C) Fluorescence measurements of the originally found candidate 10A, the mutated one ΔAUG and the CFX riboswitch (CFX-RS). Shown are the fluorescence values without (black bars) and with 1 mM CFX (white bars). Above each construct, the regulatory activity is written with standard deviation (SD) in brackets. (D) Investigation of the impact of each single mutation. As in C, the fluorescence values without and with 1 mM CFX are plotted and the regulatory activity and SD in brackets is shown on the right, respectively.

