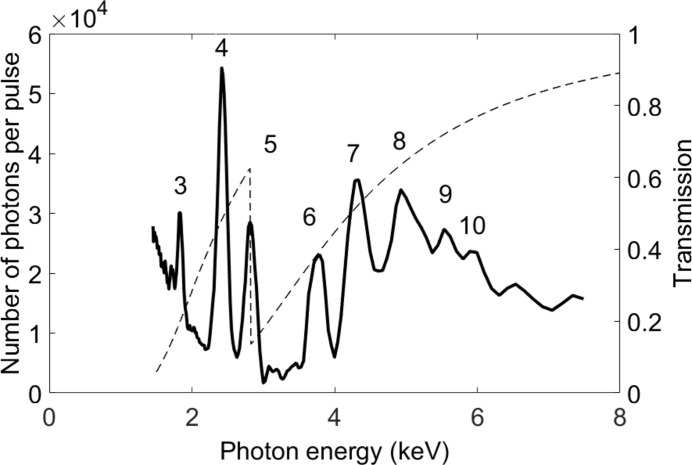
Figure 2.
Monochromator scan using the MLM with the Ni-B4C stripes. The harmonic numbers are given. The beam has passed through a Parylene C filter so that the chlorine edge at 2824 eV is visible. The filter transmission (right axis) is given as a dashed line. The photon numbers correspond to the detected number of phonons after the calibration filter and the multi-layer mirror pair, which has a transmission ranging between 30% and 50% in this photon energy range.

