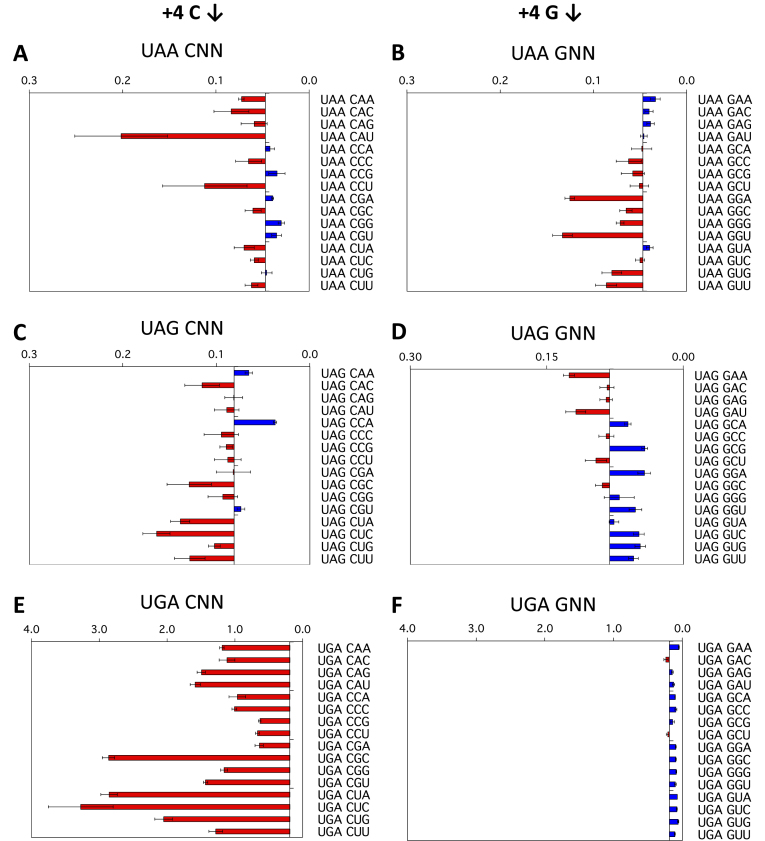
Figure 2.
Termination efficiencies of the +1UAA(C/G)NN+6, +1UAG(C/G)NN+6 and +1UGA(C/G)NN+6 signals (+4 position). Termination efficiencies of the +1UAA(C/G)NN+6 (A, B), +1UAG(C/G)NN+6 (C, D) and +1UGA(C/G)NN+6 (E, F) sequence contexts measured in COS-7 cultured cells. Readthrough (%) was calculated by comparison to near-cognate control constructs (CAG/UAA, UAU/UAG, and UGG/UGA) and plotted on the x-axis. Termination efficiencies are presented according to the identity of the base immediately following the termination codon (+4). Results are graphed relative to the median termination efficiency for the series (0.047% UAA, 0.081% UAG and 0.190% UGA). Red bars represent levels of readthrough greater than the median (left) and blue bars represent levels of readthrough less than the median (right). Experiments were performed in triplicate with two independently isolated constructs for each signal context. Mean values are presented ± SEM.

