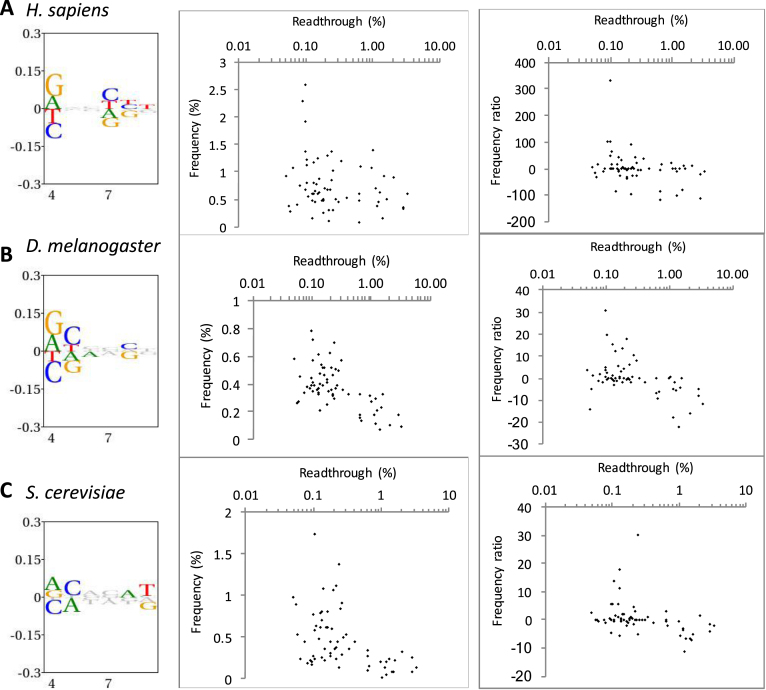
Figure 5.
Hexanucleotide bias and stop codon readthrough in the genomes of three eukaryotic species. Left panels show information content and bias through the +4 to +9 positions downstream of all stop codons in each organism. The height of all symbols at any given position specifies the information content, and over-and under-represented nucleotides are assigned positive and negative values, respectively. Middle and right panels show the correlation between measured readthrough and hexanucleotide stop codons beginning with UGA. In the middle panel, frequency among all analysed genes is shown. In the right panels, readthrough is plotted against a frequency ratio, (observed − expected)2/expected (see Methods for details) to adjust for local nucleotide bias. (A) H. sapiens (9482 analysed sequences). (B) D. melanogaster (2280 sequences). (C) S. cerevisiae (1598 sequences).

