Figure 5.
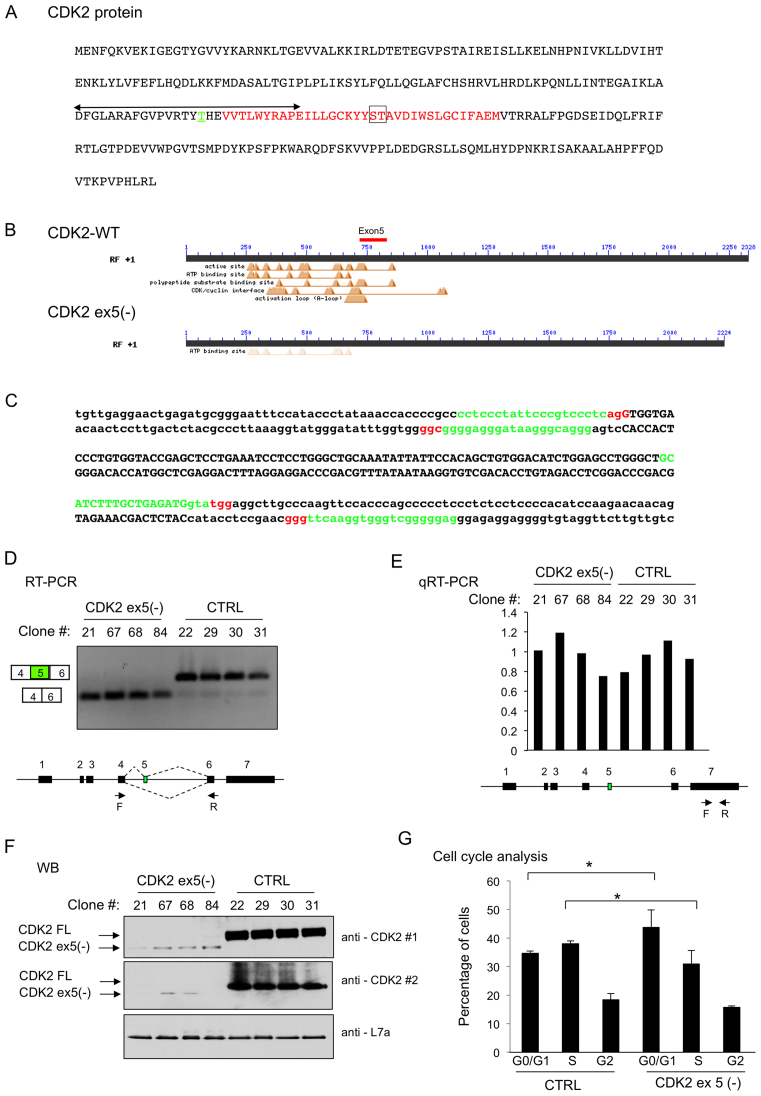
CDK2 ex5 encodes a protein segment critical to CDK2 function. (A) Human CDK2 protein primary structure. The region encoded by exon 5 is in red font; the CDK2 ‘activation domain’ is indicated by double headed arrow; T160 phosphorylation site critical to CDK2 action is in green font and underlined; the ST(181–182) dipeptide critical for CDK/cyclin interface is boxed. (B) Conserved Domain (CD) analysis (http://www.ncbi.nlm.nih.gov/cdd) of CDK2 (CDK2-WT) and the protein encoded by the CDK2 ex5(–) mRNA. The position occupied by the segment of CDK2 encoded by exon 5 is shown as a red bar. The CD analysis of the CDK2 ex5(-), shown on the second line, reveals a predicted loss of the major functional domains. (C) sgRNAs designed to ablate exon 5 region from the CDK2 locus via directed Cas9 cleavages. The double-stranded sequence of the genomic DNA encoding exon 5 (upper case) and surrounding intron sequences (lower case) is shown. The positions of the four sgRNAs used in the study to target Cas9 cleavage are highlighted in green and the corresponding PAM sequences are shown in red. (D) Generation of K562 cell clones that exclusively express the CDK2 ex5(-) mRNA. RT/PCR analysis (as in Figure 2) of four WT control K562 cell clones (CTRL) and four clones with CDK2 exon 5 exclusion via direct mutations of the genomic loci (CDK2 ex5(–)). The designation of each clone is indicated above the corresponding lane. Primer positions are shown. (E) qRT-PCR analysis. CDK2 mRNA in the four control (CTRL) and four CDK2 ex5(–) clones was quantified by real-time PCR (primers shown in diagram below graph). The average of CDK2 levels in the four control clones was arbitrarily set as 1. Overall, total CDK2 mRNA levels are comparable in these two groups. (F) Western blot analysis of CDK2 ex5(–) K562 clones. The identity of each cell clone is shown above the corresponding lane. The positions of the full-length CDK2 (CDK2 FL) protein, the CDK2 ex5(–), and the loading control L7a are indicated. CDK2#1 and CDK2#2 are two distinct CDK2 primary antibodies. (G) Impact of CDK2 ex5 deletion on cell cycle kinetics. FACS analysis was carried out on cells following propidium iodide (PI) staining of three control cell clones (CTRL) and 3 CDK2 ex5(-) cell clones. The percentages of cells in each of the identified phases (G0/G1, S and G2/M) were quantified and were plotted in the histogram. Significance comparisons are as indicated (n = 3). ∗P < 0.05.

