Figure 7.
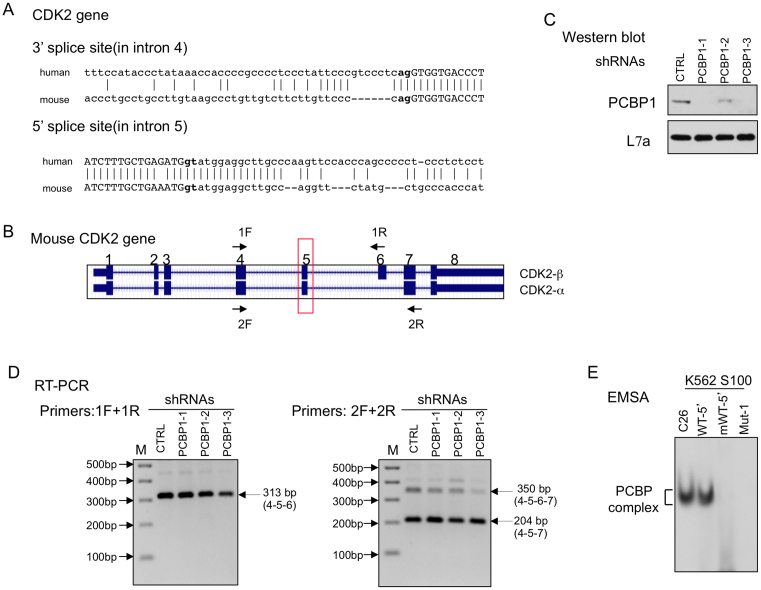
Alternative splicing of CDK2 ex5 is specific to human vs mouse. (A) Comparison of intronic sequences flanking CDK2 ex5 in humans vs mouse. Intronic sequences are in lower case and exonic sequences are in upper case. Gaps and identity in this maximal alignment are indicated by dashes and connecting lines, respectively. The acceptor dinucleotide, ag, and the splice donor dinucleotide, gt, are bolded. (B) Two CDK2 isoforms are generated in the mouse via alternative splicing of exon 6 while splicing of exon 5 in the mouse (boxed in red) is constitutive. Sequence corresponding to exon 6 sequences can be identified in the human CDK2 gene within intron 5, but this region is not spliced into the human CDK2 mRNA. The two primer sets used for splice analysis (RT/PCR, in D) is indicated by the F (forward) and R (reverse) arrows. (C) Depletion of mPCBP1 in mouse erythroleukemia (MEL) cells. Three independent shRNAs targeting PCBP1 mRNA (shRNAs PCBP1-1, 1-2, 1-3) and a control shRNA (CTRL) were used in this study. The efficiency of PCBP1 depletion was confirmed by Western blot with antibodies to PCBP1 or loading control L7a. (D) PCBP depletion fails to impact on CDK2 exon 5 or 6 splicing in mouse cells. RT-PCR analyses of RNA isolated from PCBP1 depleted vs Control cells: Left: RT-PCR with primer set 1F (in exon 4) and 1R (in exon 6). The 313 bp PCR product corresponds to exons 4–5–6. This assay fails to detect exon 5 skipping (predicted to be 211 bp). Right: RT-PCR with primer set 2F (in exon 4) and 2R (in exon 7). This RT-PCR generate only two RNA species; the 350 bp product corresponds to CDK2β (exons 4–5–6–7) and the 204bp product corresponds to CDK2α (exons 4–5–7). This assay fails to detect evidence of exon 5 skipping (predicted to be 248 bp). The identities of all three RT-PCR products were confirmed by Sanger sequencing. M: 100 bp DNA ladder. (E) PCBP binds to the exon 5 splice acceptor region of the human, but not the mouse, CDK2 transcript. PCBP binding to the human (WT-5′) and mouse (mWT-5′) CDK2 exon 5 PPT splice sites was directly compared in vitro by RNA EMSA (as in Figure 1D). The C26 homoribopolymer served as a positive control and Mut-1 RNA (Figure 1B) as a negative control for the formation and migration of the PCBP/RNA complex.

